Datadog
Connect Datadog monitors to OpsLevel and see their current statuses in your context-rich service catalog.
Datadog + OpsLevel Benefits
Integrating OpsLevel and Datadog makes it easy for anyone in your engineering organization to see the statuses of all your monitors in real time, alongside the complete context of your service catalog.
For SREs, platform engineering, or engineering management, OpsLevel can be used to ensure Datadog monitors are configured correctly and active on all the relevant services.
You can also use Datadog Alert Sources to Detect Services not already present in your software catalog.
Integrating with Datadog
This guide will walk you through how to integrate Datadog with OpsLevel Alert sources to make it easier for your organization to view up-to-date monitor status alongside your Service Catalog. You can also integrate OpsLevel and Datadog using Datadog Checks to build Datadog monitor status into your Service Maturity Rubric. To configure Datadog checks, check out the Datadog Checks Integration guide.
How it Works
OpsLevel’s Datadog integration listens for any status changes in your associated Datadog monitors.
Note: Synthetic testing monitors are supported.
Status Levels
The relationship between Datadog monitors and linked alert sources on OpsLevel services follows the pattern below:
| Datadog monitor | Linked OpsLevel service |
|---|---|
| No Data | gray No Data state |
| Alert | red Alert state |
| Warn | orange Warn state |
| OK | green OK state |
Datadog Usage Checks
For guidance on setting up a check to verify Datadog is used on all services in your catalog, read more on Alert Source Usage Checks here.
Requirements
Configuring the Datadog Integration in OpsLevel requires both the Datadog API Key and Datadog Application Key. When retrieving the keys from Datadog, the logged in user must be an Admin user with the following permissions enabled:
- User Access Read (user_access_read)
- Monitors Read (monitors_read)
- Monitors Write (monitors_write)
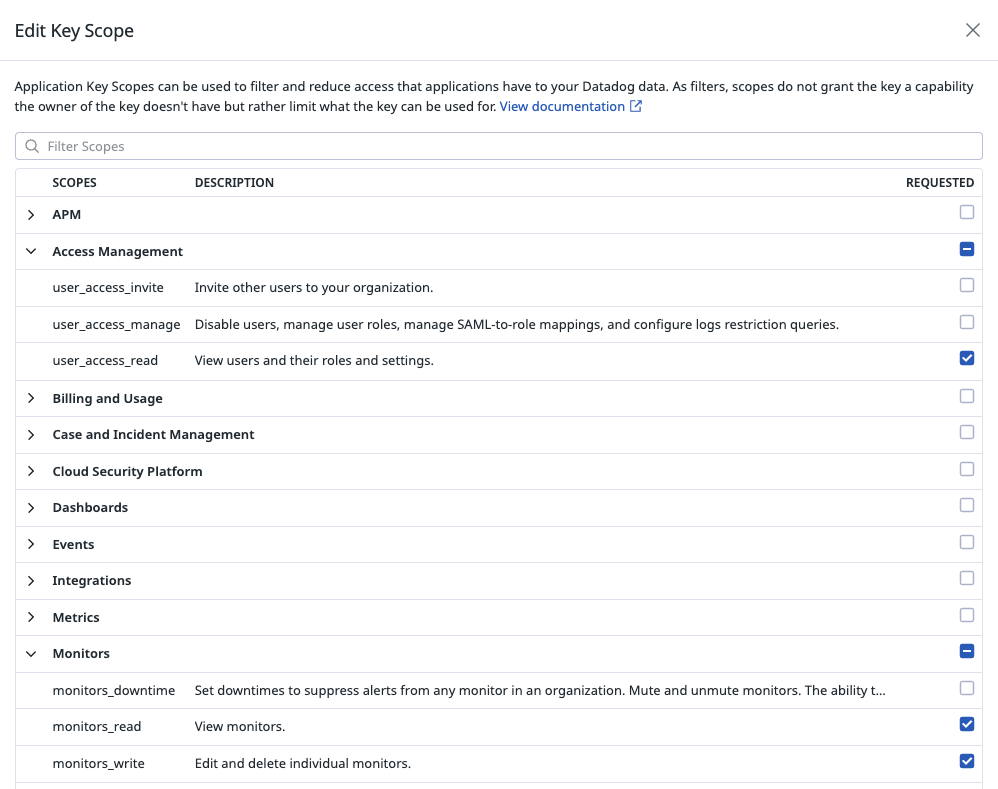
You can verify your permissions on your profile page in Datadog.
OpsLevel needs authentication keys from users with these permissions so that the integration can find and update Datadog monitors in order to use webhooks to send updated monitor status to OpsLevel.
Support
OpsLevel support is available at [email protected] or via your shared OpsLevel Slack channel.
Installation
Installing the Datadog integration can be completed in seconds.
1. In the OpsLevel app, from the left-hand menu, navigate to Integrations and click the New Integration tile.
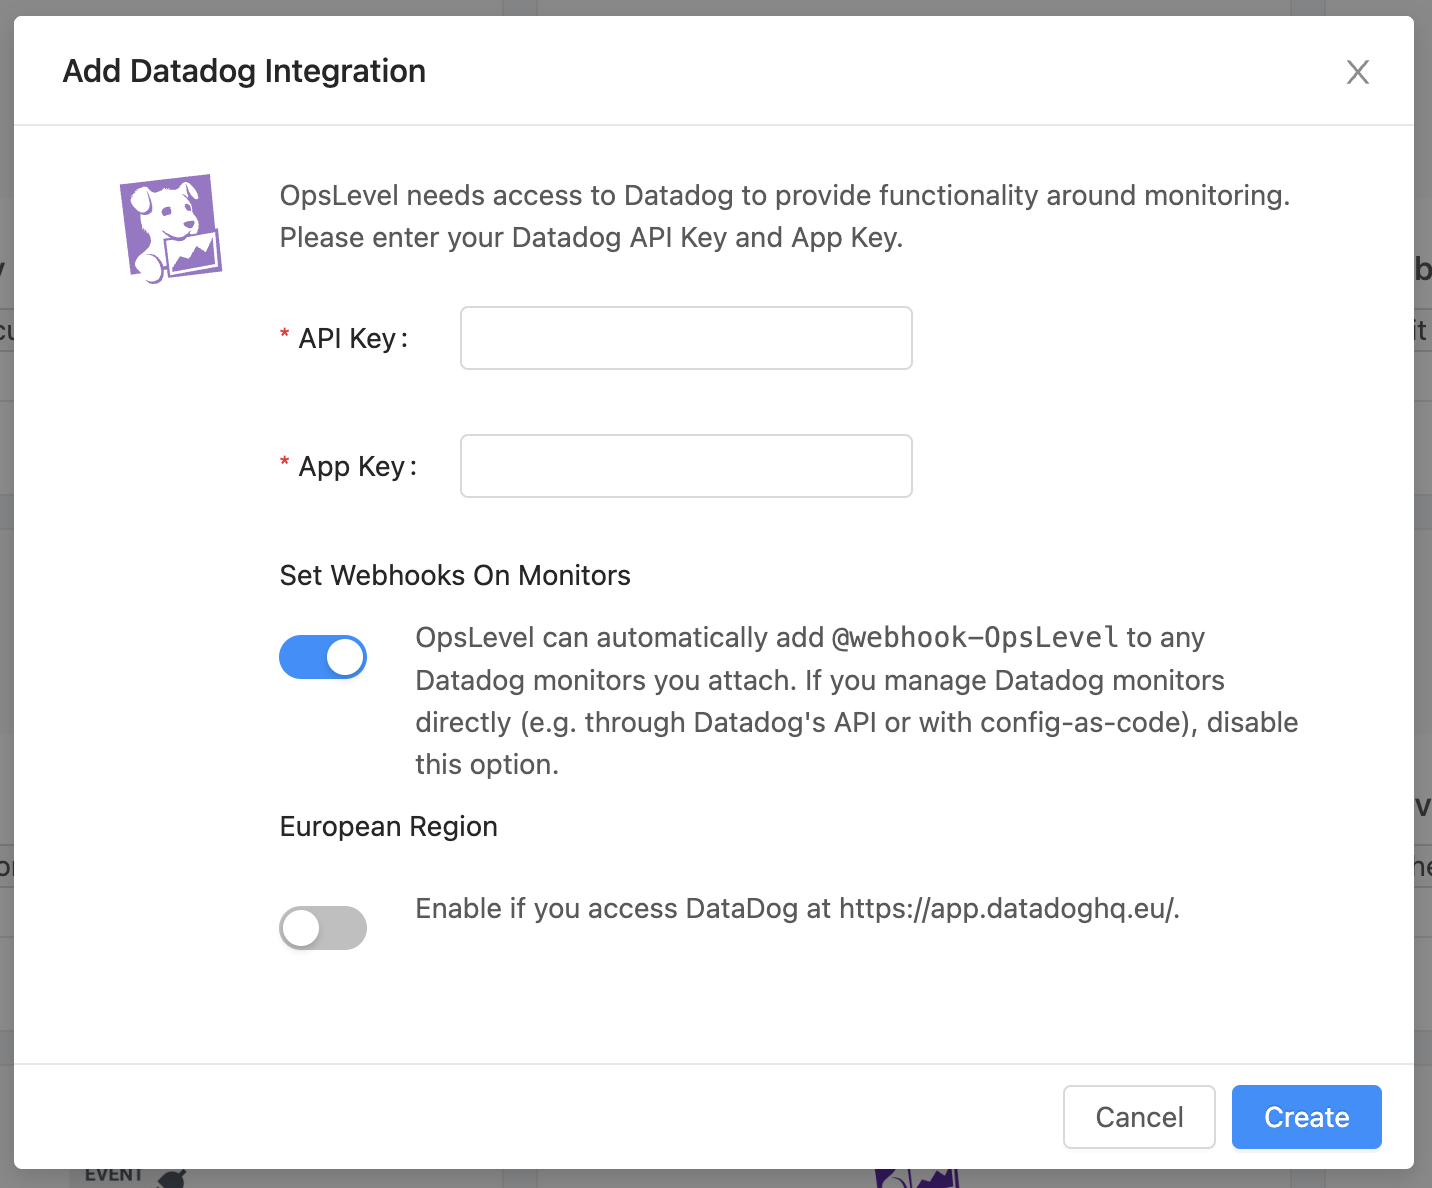
2. Click the Datadog tile and then enter your API and APP keys.
Note: Ensure that the authentication keys' associated user has both the monitor_read and monitor_write permissions enabled.
3. Make sure @webhook-OpsLevel gets added to any Datadog monitors that you attach to OpsLevel Services. OpsLevel can automatically do this on your behalf if the Set Webhooks On Monitors option is enabled. If you prefer to manage your Datadog monitors directly (e.g. through Datadog’s API or with config-as-code), disable this option.
On the next screen you’ll be presented with a detailed getting started guide to configure webhook delivery from Datadog to OpsLevel.
How to attach a Datadog monitor to a service in OpsLevel
There are two ways to attach a Datadog monitor to an OpsLevel service. Automatic and Manual
Automatic attachment
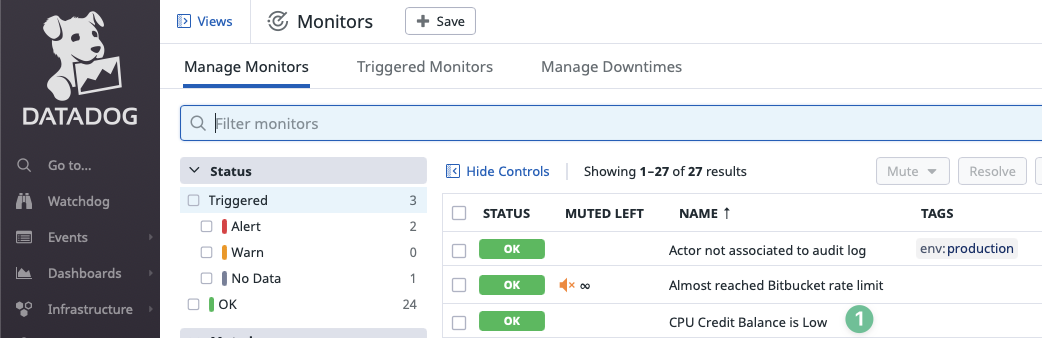
First, log into your Datadog account and navigate to the Monitors page.
- Click on the monitor you want to be automatically attached.
- Add a tag following the
service:service_aliaspattern. Any of the aliases registered for the service can be used. Tip: The tag in the Datadog monitor is case-insensitive.
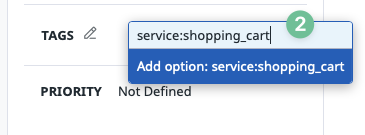
- Ready! Your monitor will be attached to the service automatically.
Note: If a tag was removed from the Datadog monitor, the link with the service will not be automatically removed! If you want to remove it, you have to do it manually.
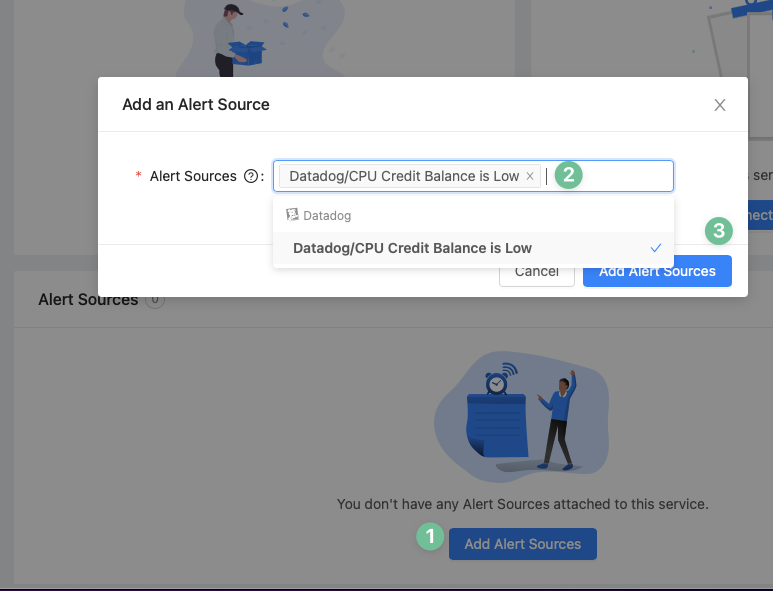
Manual attachment
First, navigate to the Operations tab of an OpsLevel service.
- As shown in the screenshot below, Select Add Alert Sources
- In the drop-down menu, find and select the correct Datadog monitor (you can type its name to search)
- Click the Add Alert Sources button on the dialog box to save your selection(s)
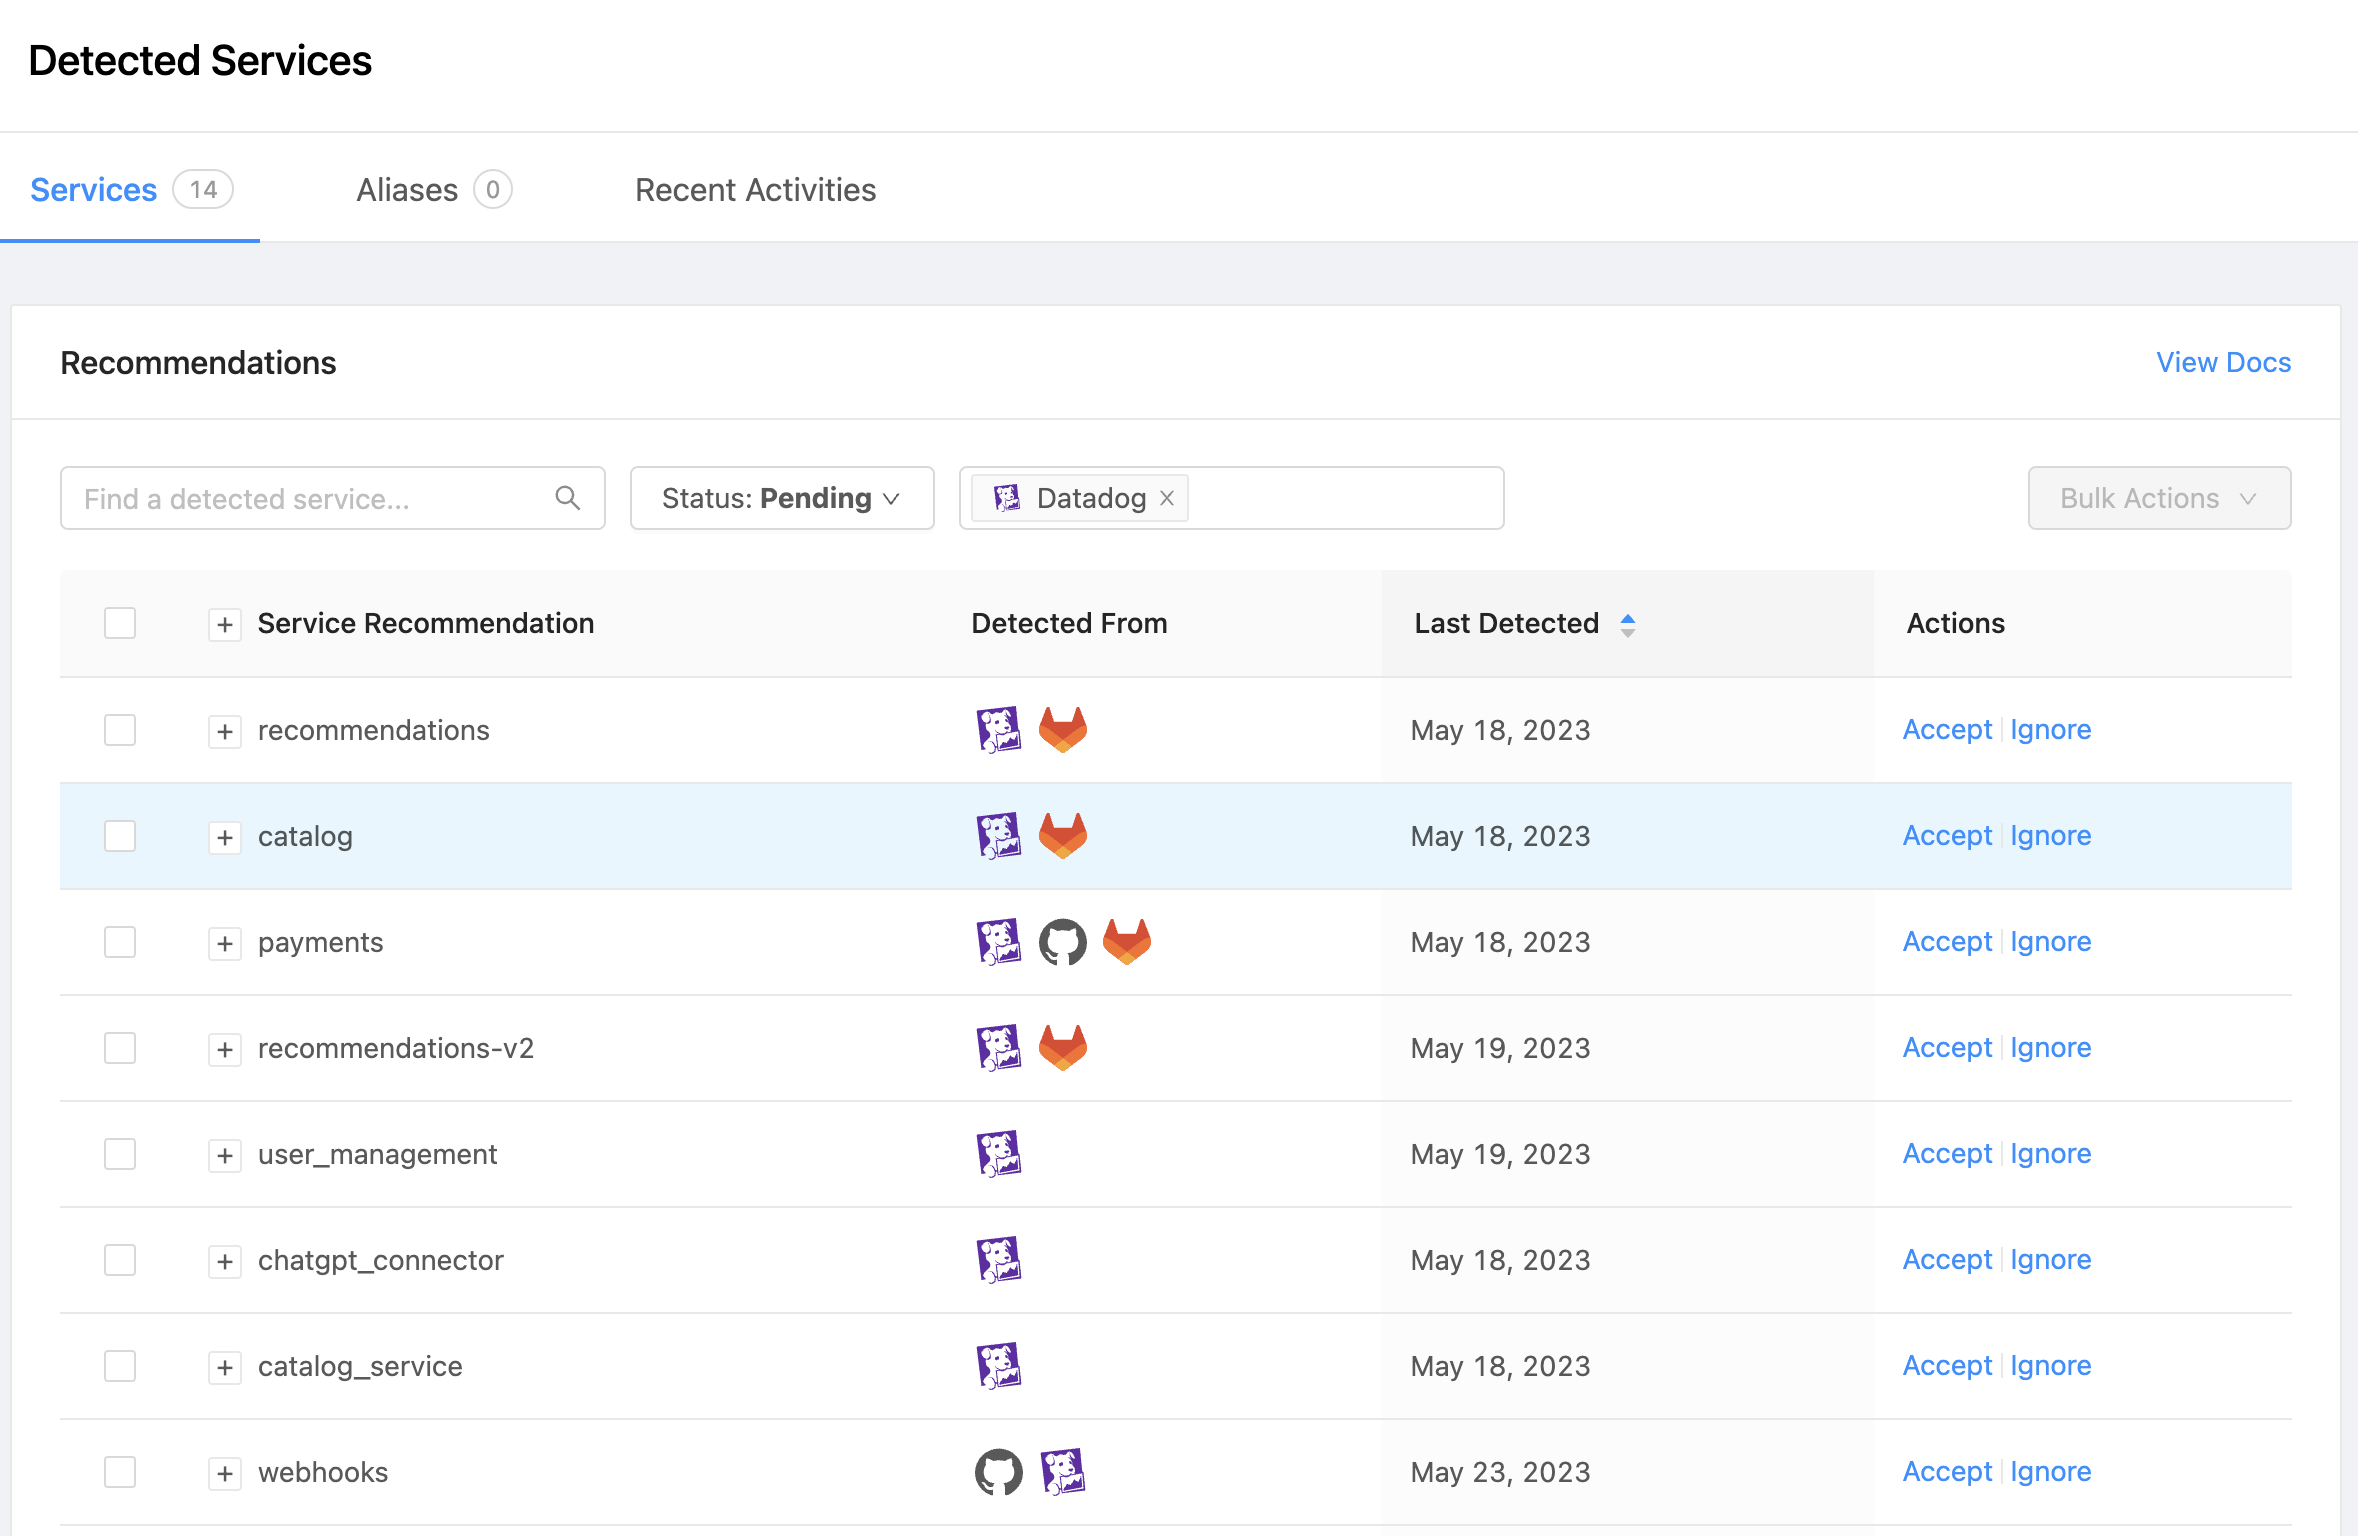
Detecting Services using Datadog Alert Sources
When a Datadog monitor includes a service tag for a service alias not found in your catalog, OpsLevel can create a service suggestion. Service suggestions are found in the Service Detection page, for more information on how to interact with these suggestions check out this guide. To receive suggested services, ensure that your Datadog integration has Service Detection enabled
If a Datadog monitor detects a service, when the service is accepted it will include:
- A link to the Alert Source on the Operations tab
- If all Datadog monitors on the suggested service include only a single
team:tag, then OpsLevel will attempt to look up a team in OpsLevel that has the tag value as an alias and associate that team as the Owner of the new Service.
Updated 8 months ago