Custom Event Checks
Send arbitrary JSON payloads to OpsLevel to evaluate the maturity of your services. Using jq, you can parse out service identifiers from your payload and determine whether the check, scoped to each found service, passes or fails. You can also customize check result messages using Liquid templates.
OpsLevel helps keep your services consistent and healthy through the use of various pre-built checks. However, not all checks fall in line with one of the pre-built checks provided by OpsLevel.
With custom event checks, you can easily integrate with any third party platform to create custom, data driven checks. The result message has the full context which can be templated to provide service owners with an informative message.
Custom event checks allow you to evaluate various conditions by sending any JSON payload to OpsLevel. The following are examples of conditions you can evaluate using these checks:
- Using your vulnerability detection tool to ensure that no Tier-1 services have open vulnerabilities.
- Using your vulnerability detection tool to ensure no Ruby services have high criticality vulnerabilities.
- Ensuring your test coverage stays above a certain threshold.
Size LimitWhen using the
https://app.opslevel.compayloads will have a size limit of 4MiB and payloads above this size will received a HTTP 413 response. It is recommended to use thehttps://upload.opslevel.comdomain, which does not have a max payload size.
Getting Started with Custom Event Checks
Step 1: Create a Custom Event Integration
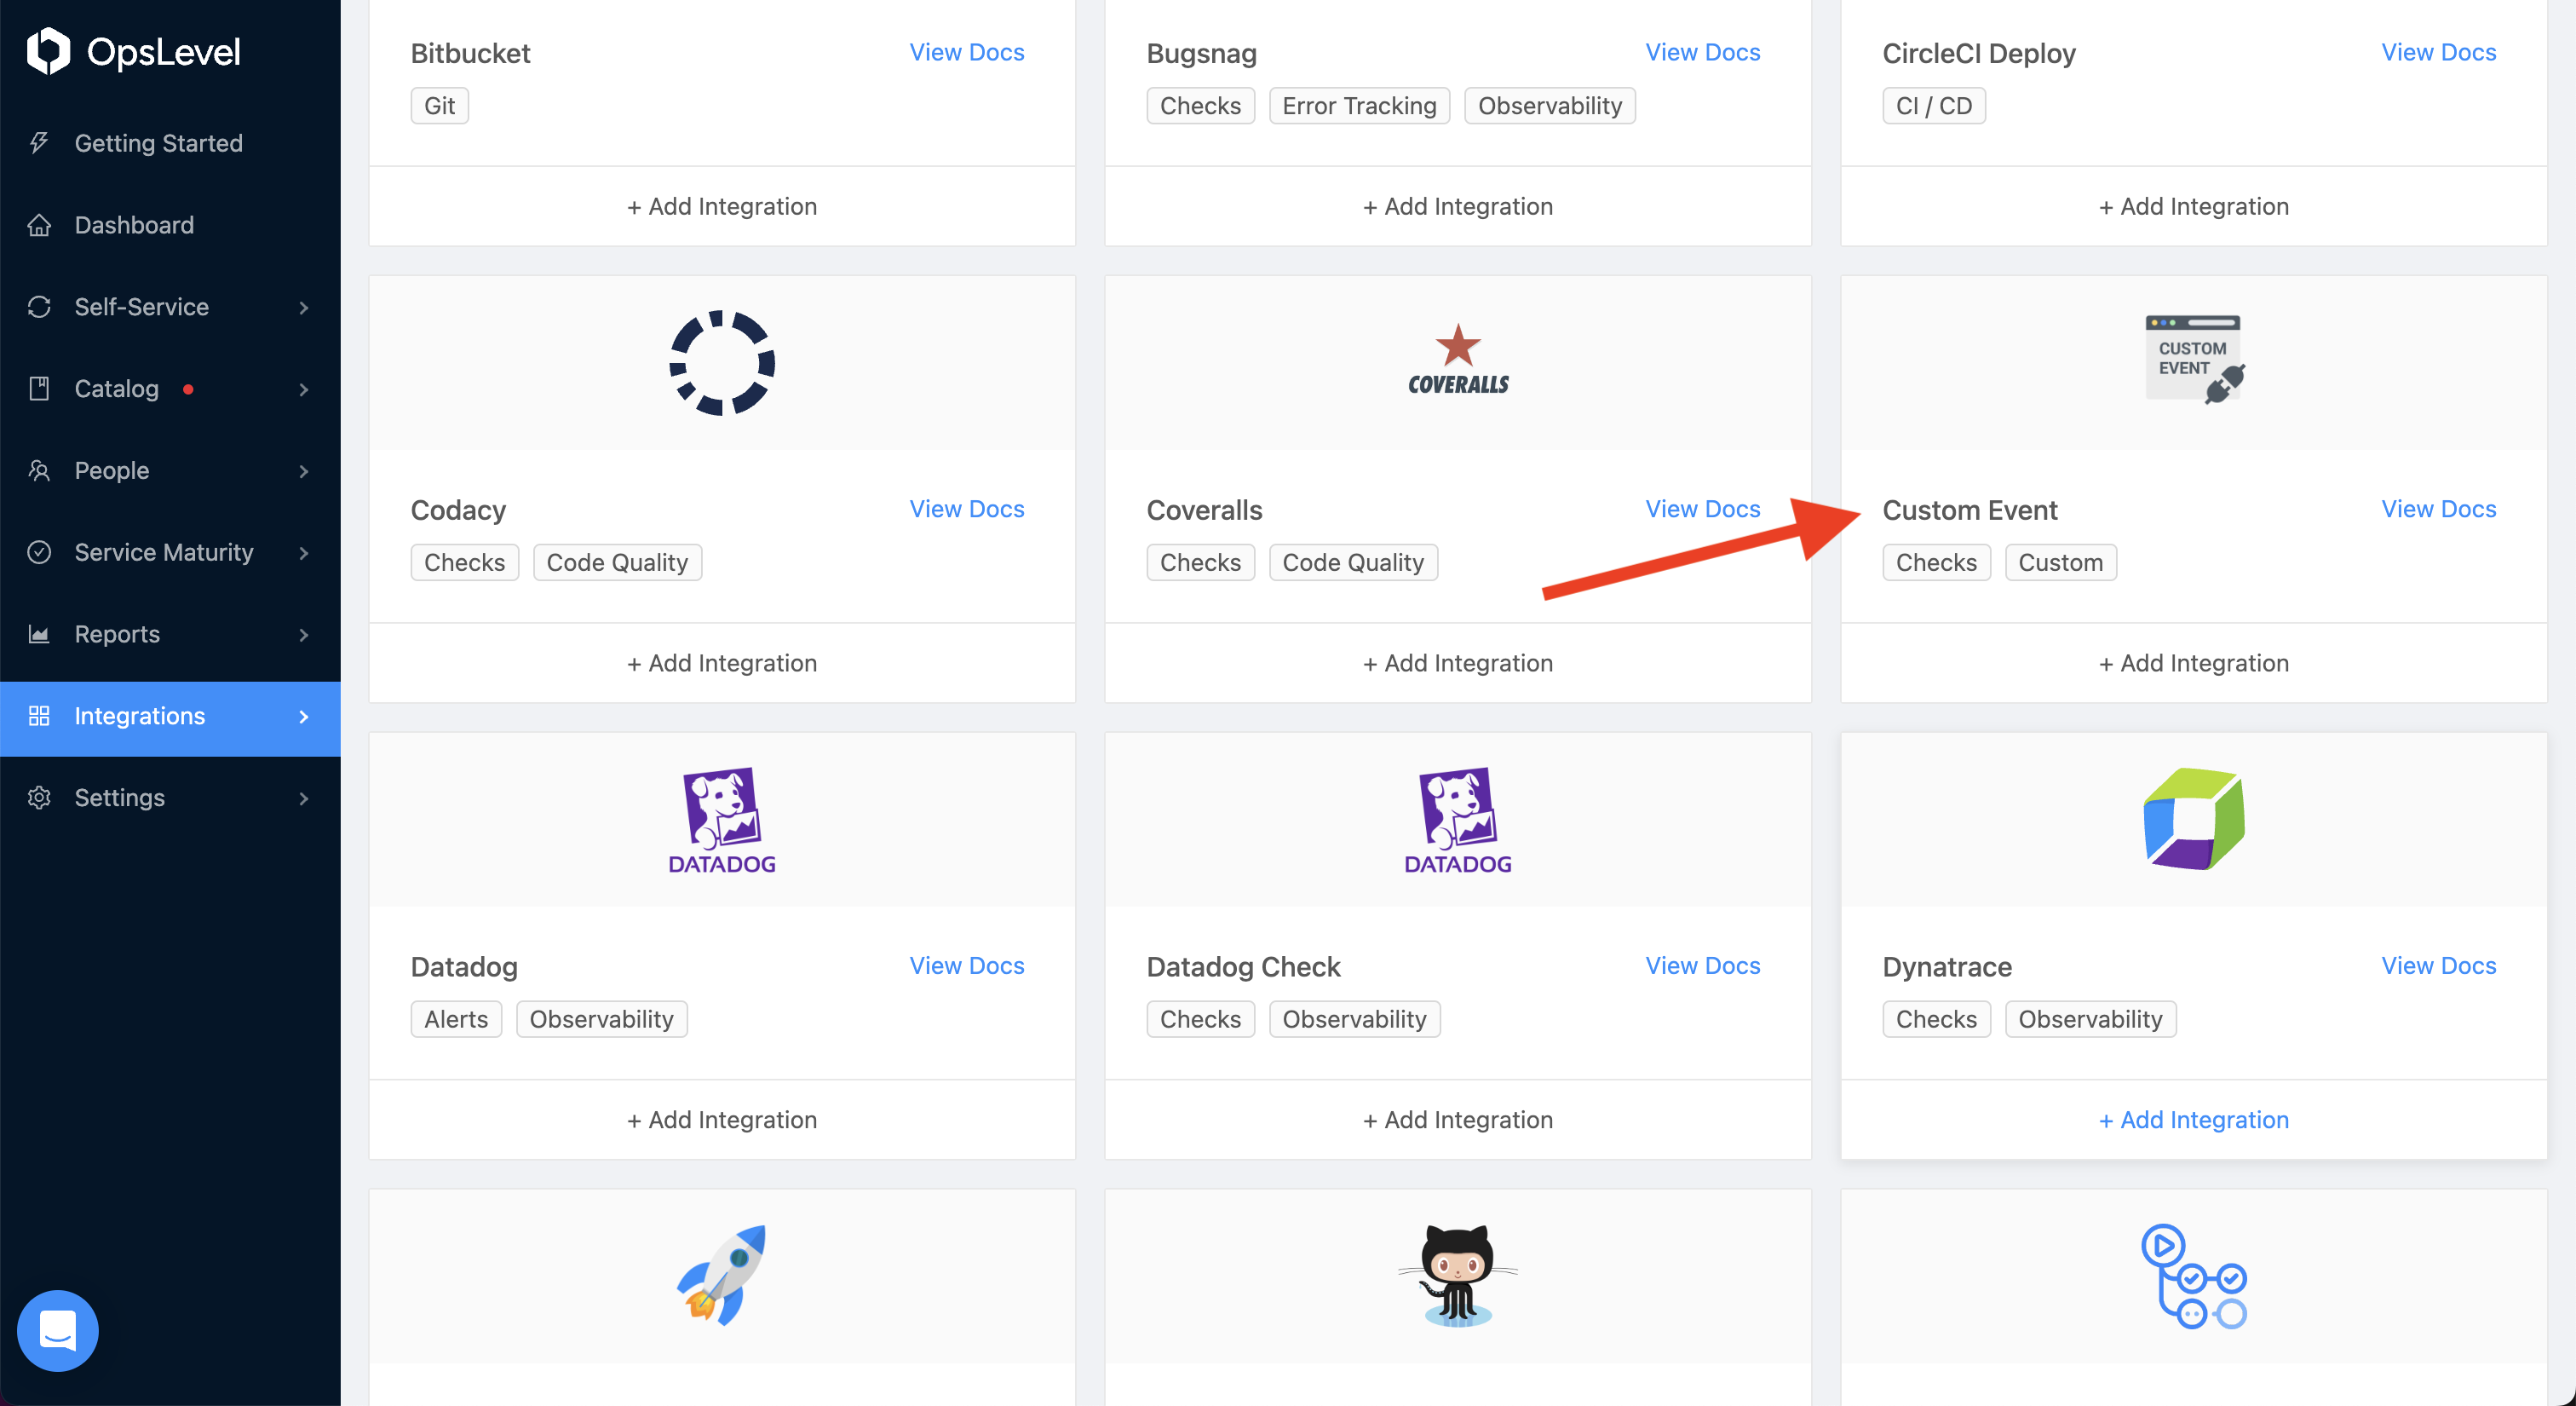
To set up a custom event check endpoint, visit the Integrations tab and select Add New Integration. Select the Custom Event tile.
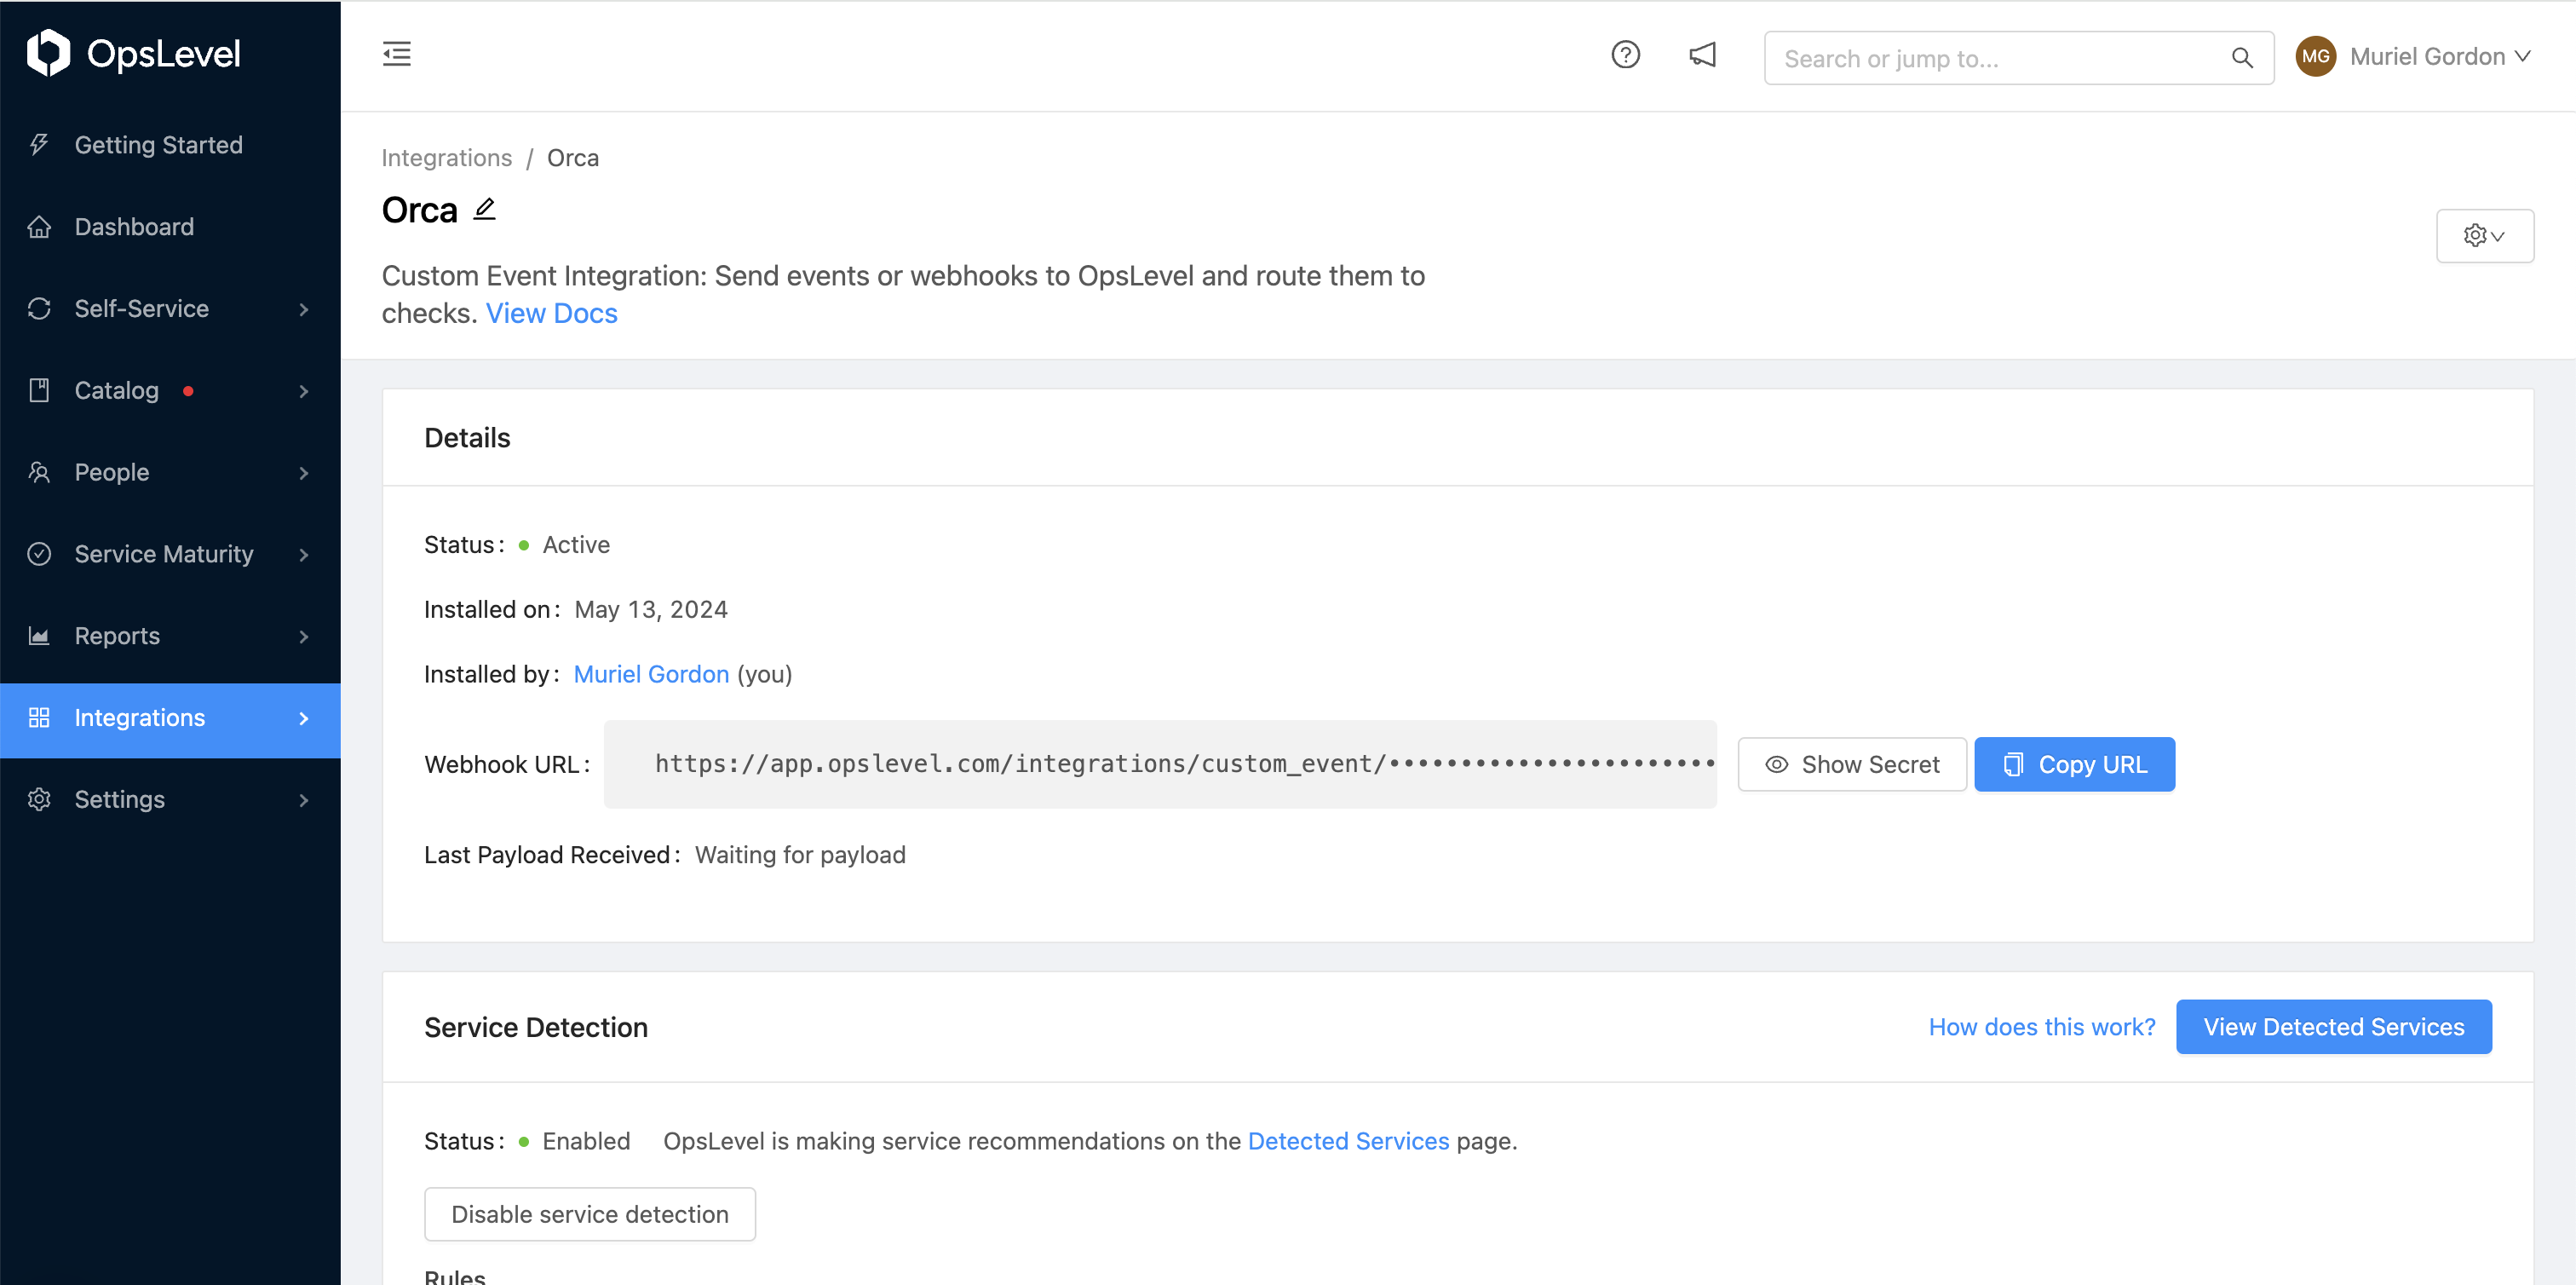
Enter the name of the system you are integrating with (e.g. Orca) and click Create.
After creating a Custom Event Integration, you’ll be redirected to a page that looks like:
Step 2: Create a Custom Event Check
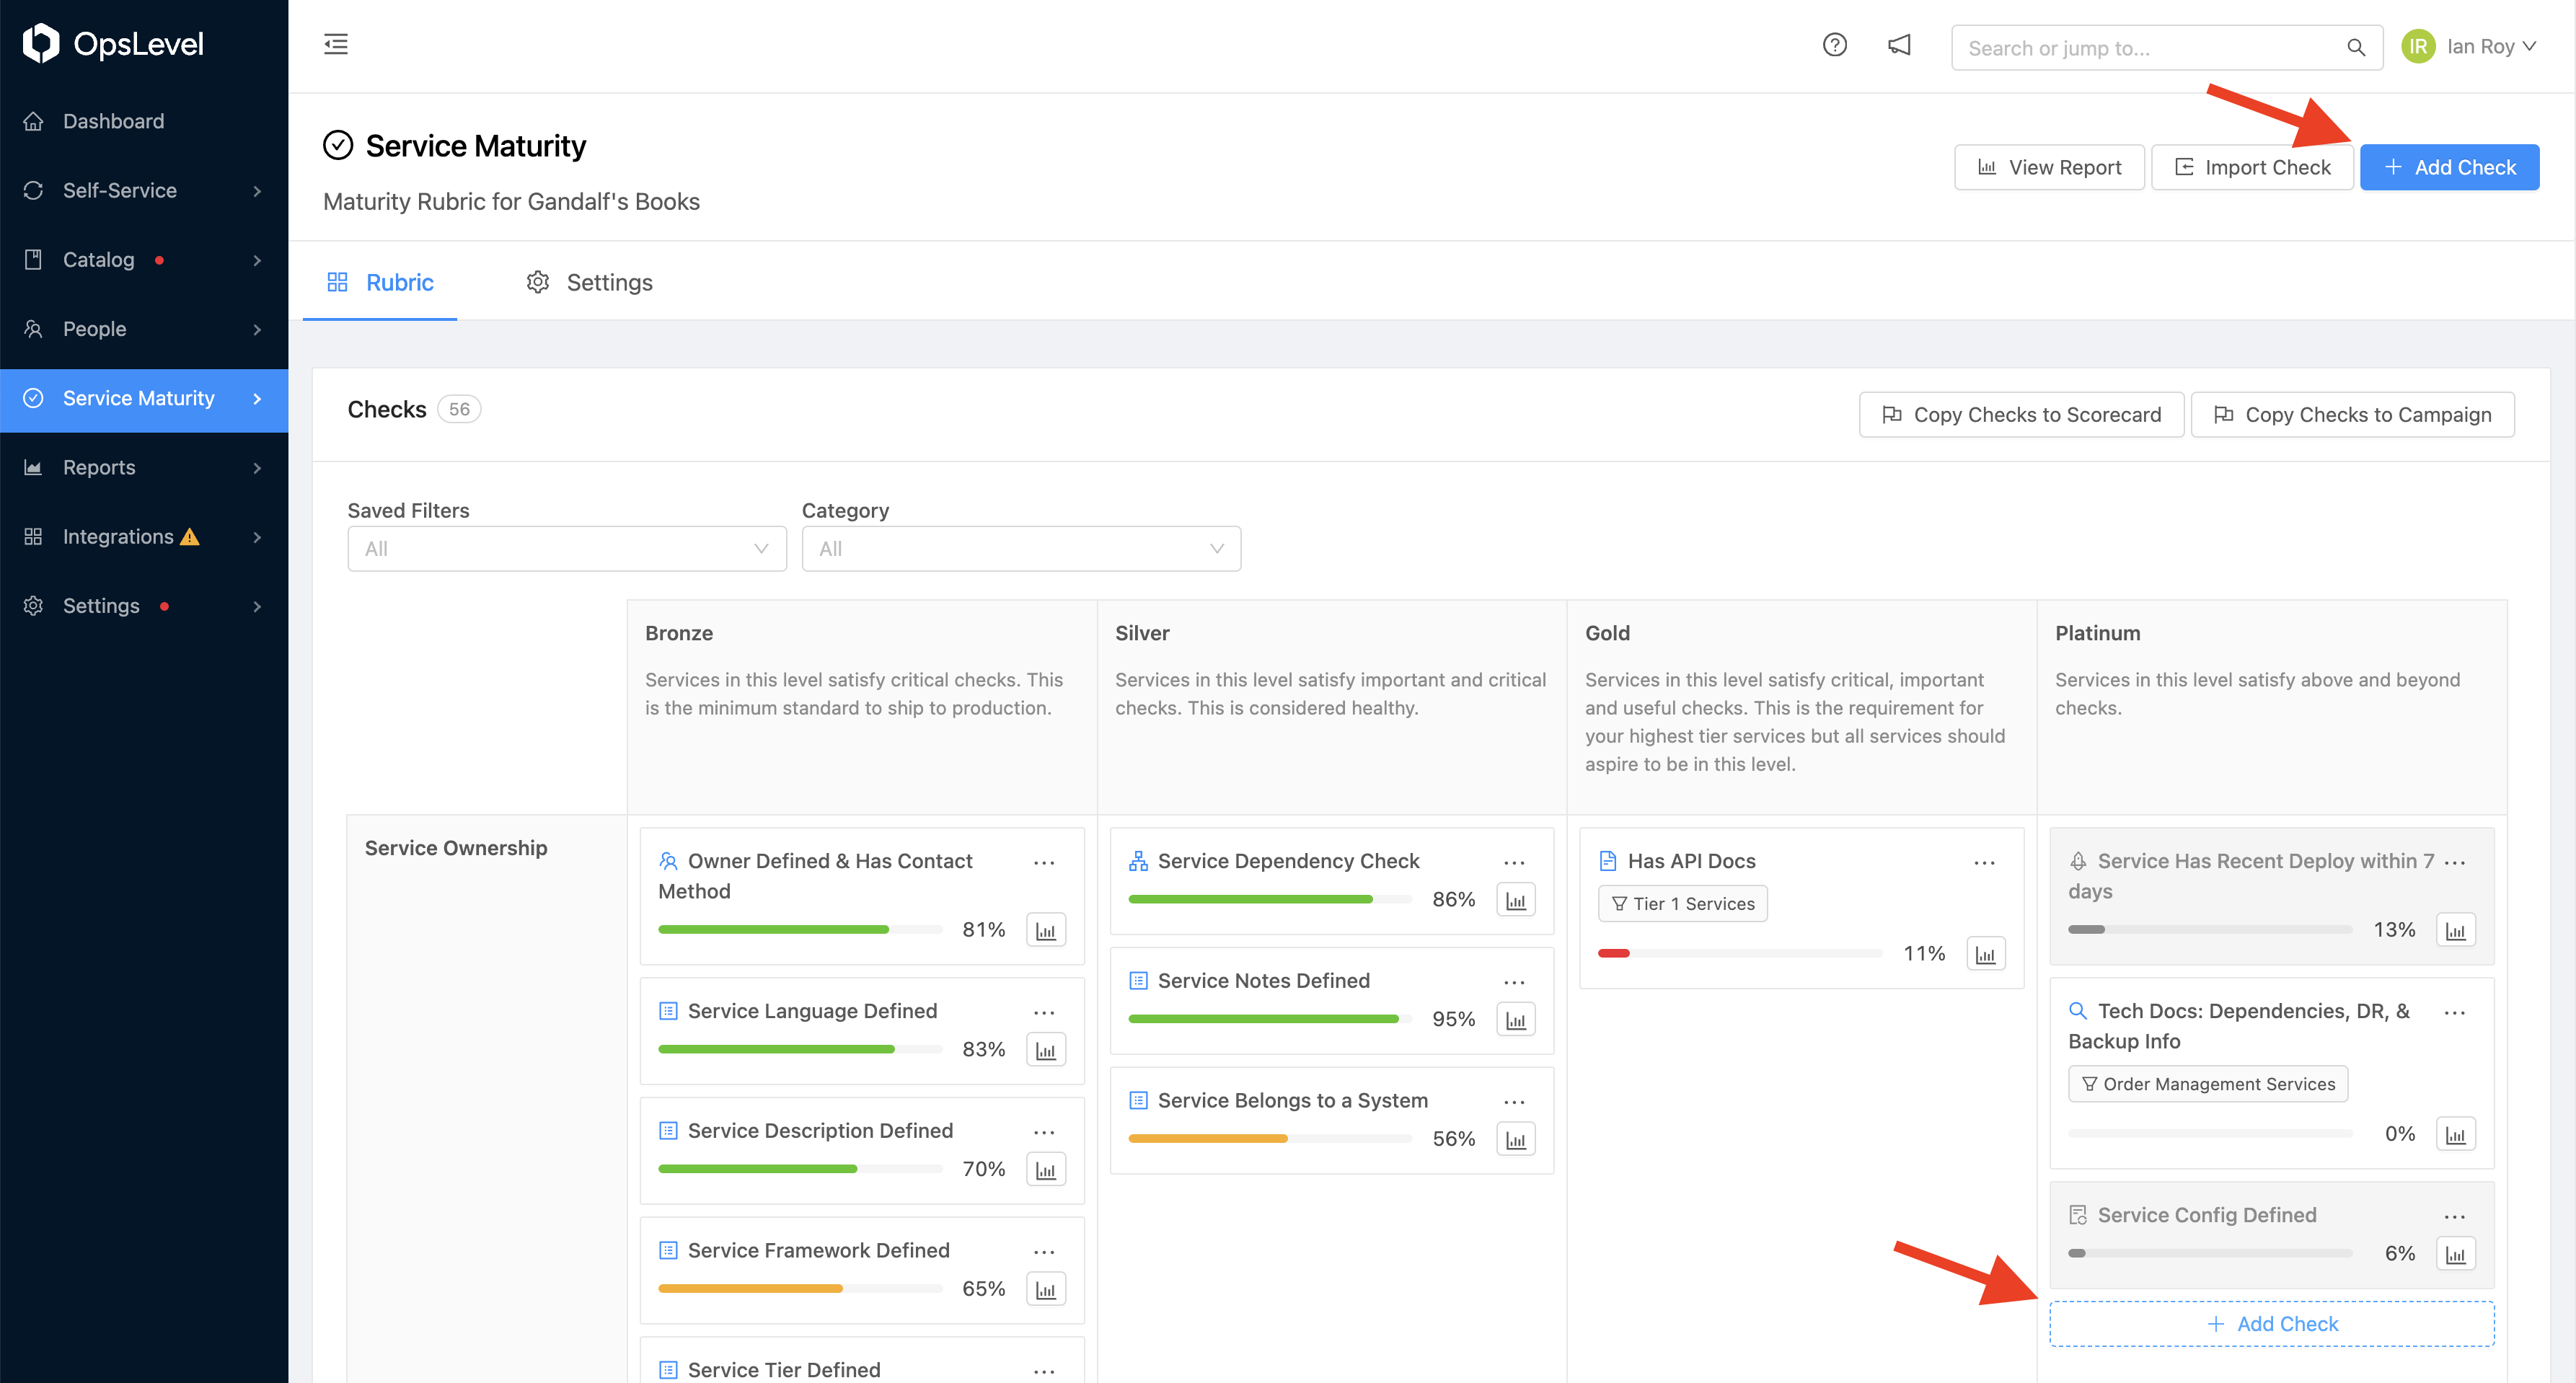
To create a custom event check, navigate to the Rubrics tab
Either in the top right corner, or inside your rubric, press the +Add Check button.
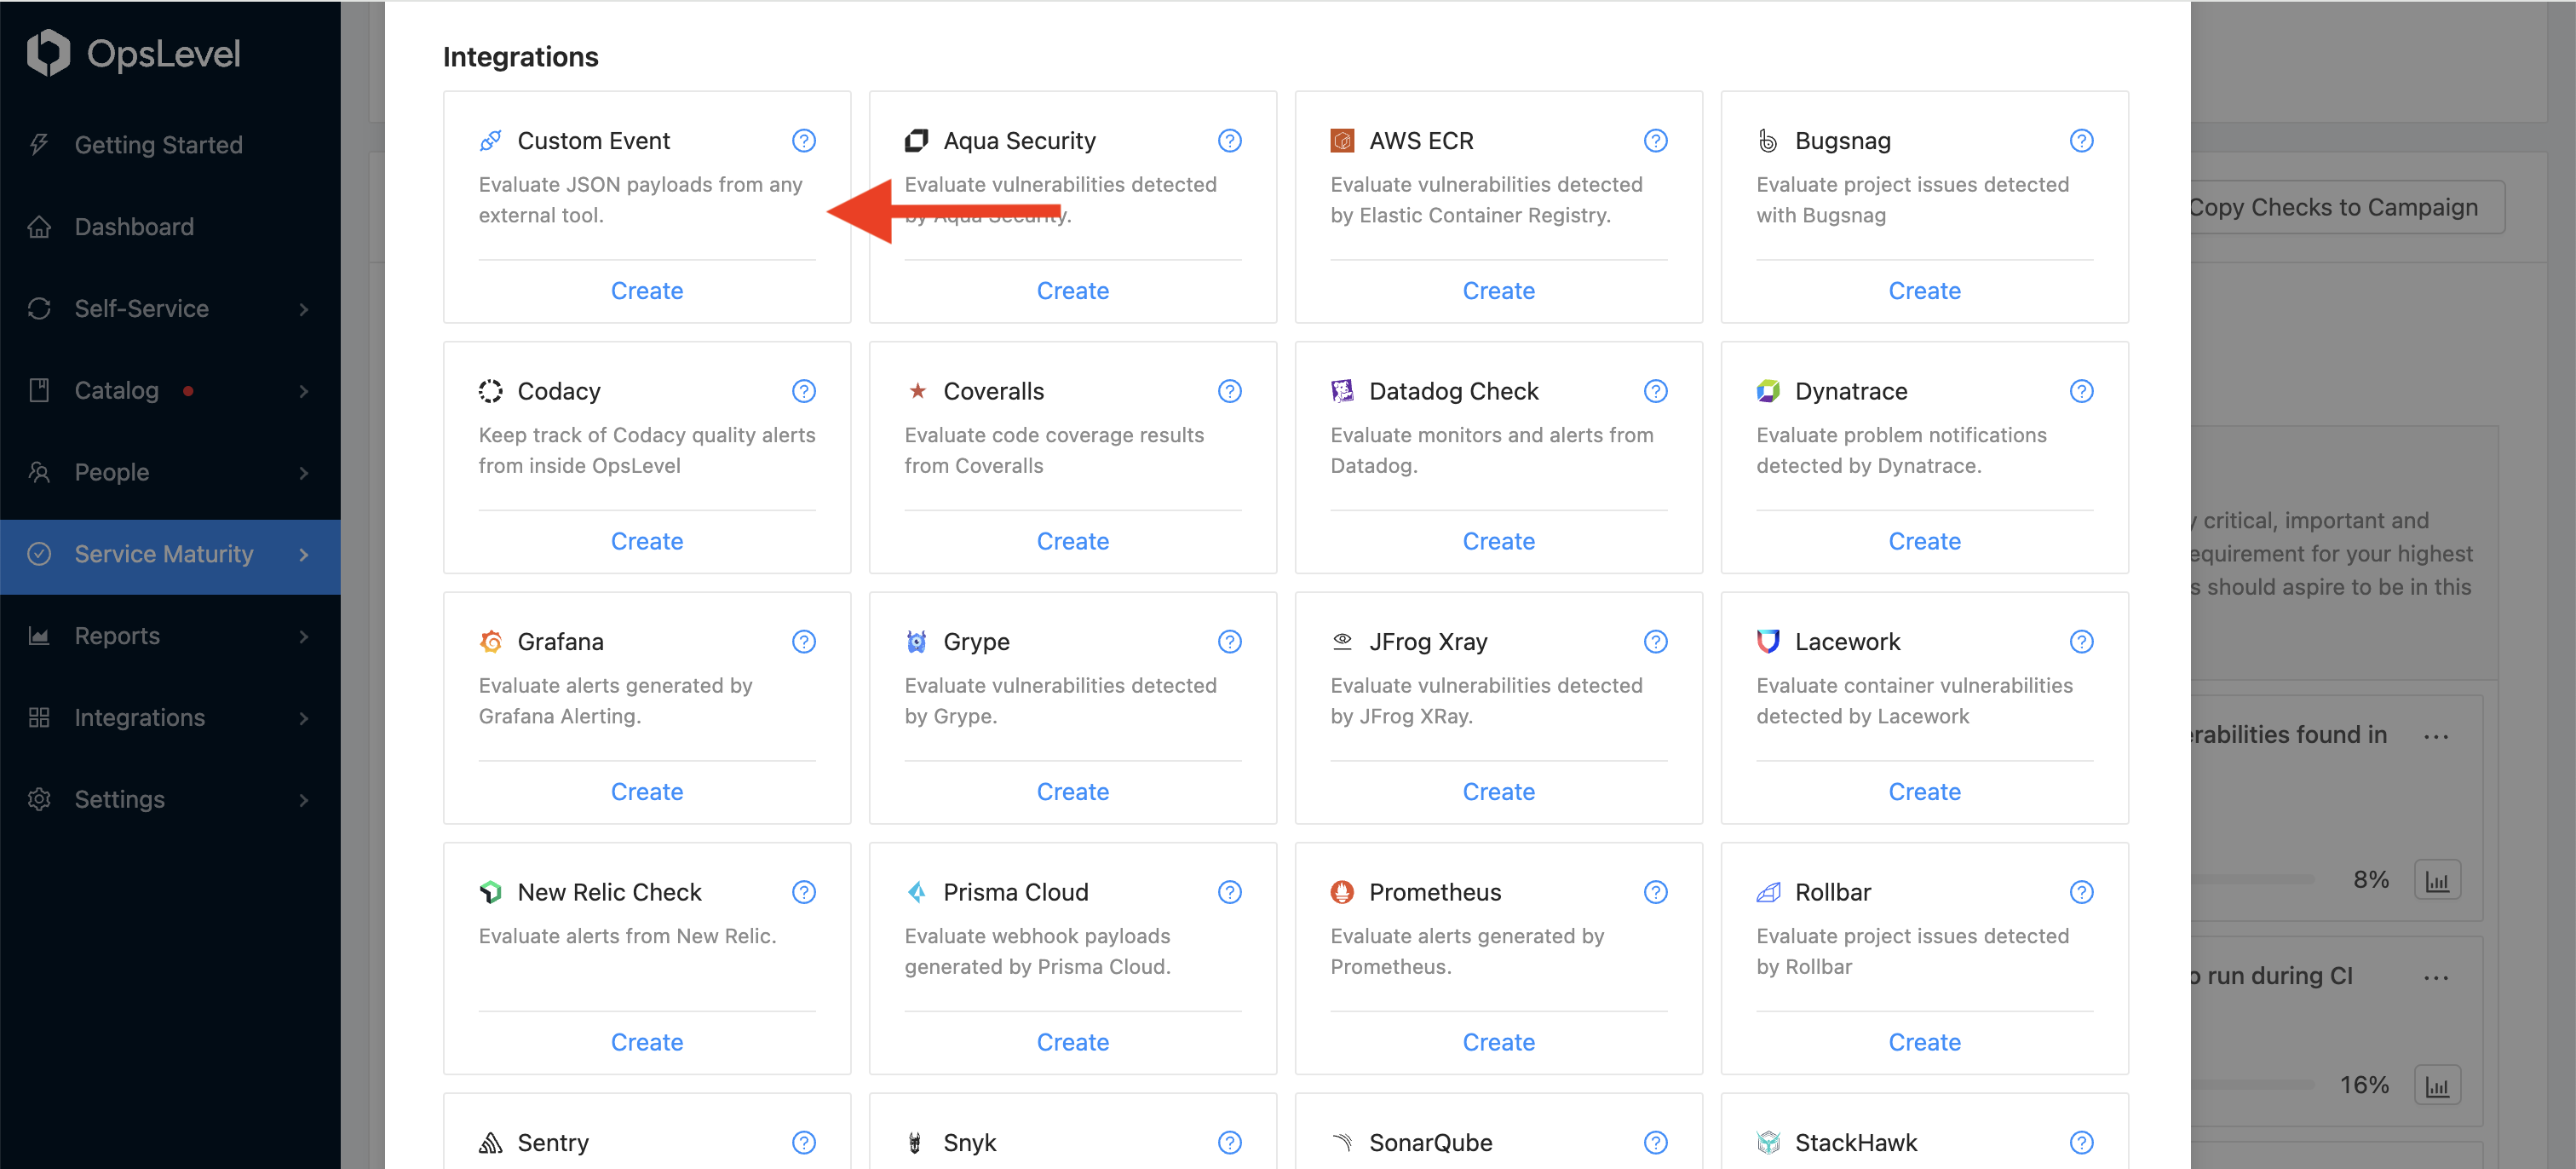
From the Create Check modal, select Custom Event from the Integrations section:
Select the Integration you previously created; it’s URL will be displayed below the dropdown after selection. This is where you should be sending your JSON payloads for the check.
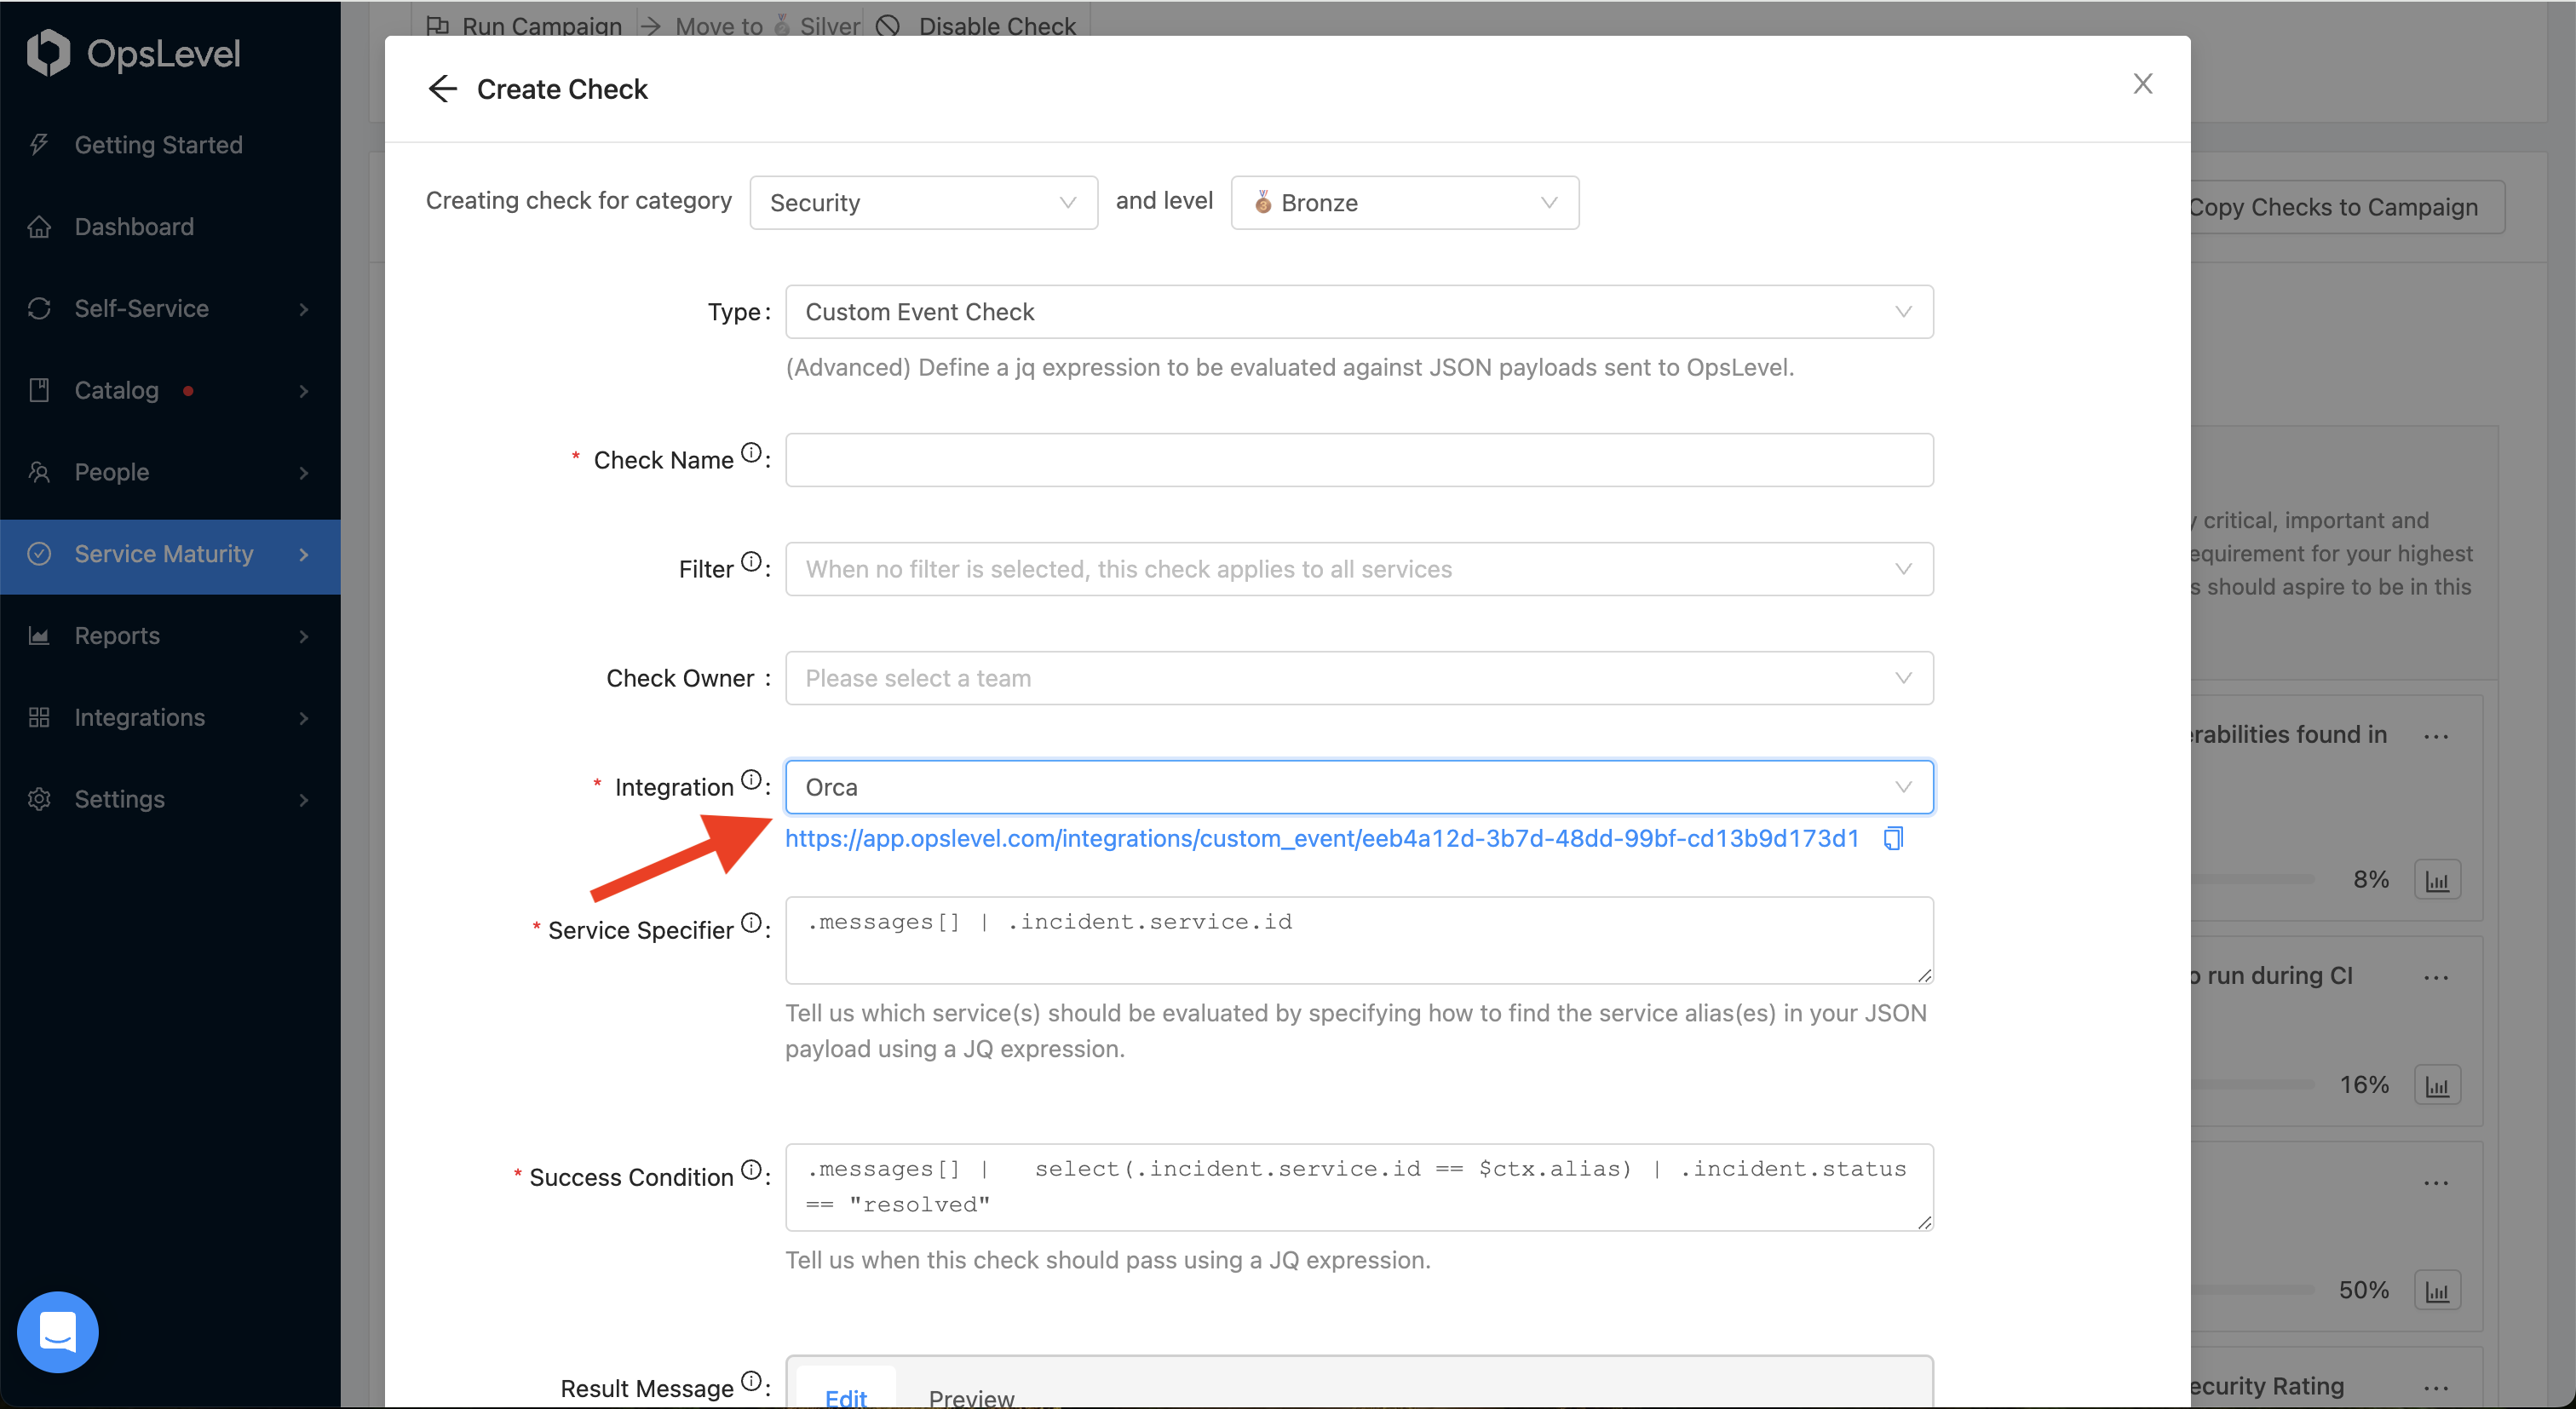
To identify your service, or services, in the sent JSON payload, you can specify a Service Specifier jq expression that will find your service aliases in the payload or query params. Refer to the service identifier section for more information and examples.
To evaluate the success of your check, specify a Success Condition jq expression that will be run against your payload to extract a boolean value to determine whether your check is passing or failing. Refer to the success condition section for more information and examples.
You can enter a Result Message to provide feedback to users regarding the success or failure of your check. The message template supports Markdown and Liquid templating. For more information and examples, refer to the Liquid Templating section.
In the Test Check section, you can test your check before creating it. Enter a sample JSON payload that resembles what you’ll be sending to the custom check endpoint and your inputs will be used to evaluate your expression, display the found services, and render your Result Message.
Note: Only the check for the first found service in your payload will be evaluated for the test.

After successfully creating a check, you will see it in your rubric.
Step 3: Sending a JSON Payload to OpsLevel
Open one of your Custom Event Checks in your rubric, and copy the URL present in the modal. This is the endpoint you’ll be sending your JSON payloads to.
Using that endpoint, make an HTTP POST request like the example below, substituting your custom check endpoint URL in place of xxxxxxxx-xxxx-xxxx-xxxxxxxxxxxx:
If your request was successful, you will receive the following response:
Examples
Single Service Payload: Check for Vulnerabilites in yarn.lock using Snyk
We can use Snyk to find security vulnerabilities in our projects. Specifically we’ll assess our yarn.lock file and send the results to OpsLevel.
We use the Snyk CLI to assess our yarn.lock file and pipe the JSON output to a curl command which POSTs to our custom event endpoint.
Note: We use the \--prune-repeated-subdependencies flag to compress our Snyk payload due to our 4MiB payload limit.
The payload sent by Snyk will look something like this:
For our check, we’ll write a Service Identifier to parse the service alias from the JSON payload.
.projectNameWe’ve identified our service, now we can write our Success Condition for the payload.
([.vulnerabilities[] | select(.severity == "high")] | length == 0) and ([.vulnerabilities[] | select(.severity == "medium")] | length <= 3) < code>Here we’re searching inside the vulnerabilites array for items with high and medium severities, and checking if there are three or less.
Finally, we’ll craft our result message using a combination of Markdown and Liquid templating.
{% if check.passed %}
  ### Check passed
{% else %}
  ### Check failed

  service **{{ data.projectName }}** has **{{ data.vulnerabilities | where: "severity", "high" | size }}** high vulnerabilities and **{{ data.vulnerabilities | where: "severity", "medium" | size }}** medium vulnerabilities.

It has **{{ data.uniqueCount }}** vulnerabilities in total.
{% endif %}
Multi-Service Payload: Check for PagerDuty Triggered Incidents
In PagerDuty, you can specify a webhook endpoint to send events that happen in your account, this would be the URL to your custom check integration.
We’ll write a Service Identifier to parse your service aliases from the JSON payload.
.messages[] | .incident.service.idNow that we have our services identified we can work on writing a Success Condition for the payload, scoped down to the section relevant to each found service.\
.messages[] | select(.incident.service.id == $ctx.alias) | .incident.status == "resolved"Here we are finding each service in the list of messages, and passing the check if the incident has been resolved. The other possible values, acknowledged or triggered, will fail the check.
Finally, we’ll craft our result message using a combination of Markdown and Liquid templating.
{% if check.passed %}
### Check passed
{% else %}
### Check failed
**{{ data.messages[ctx.alias].incident.service.id }}** has an unresolved incident.
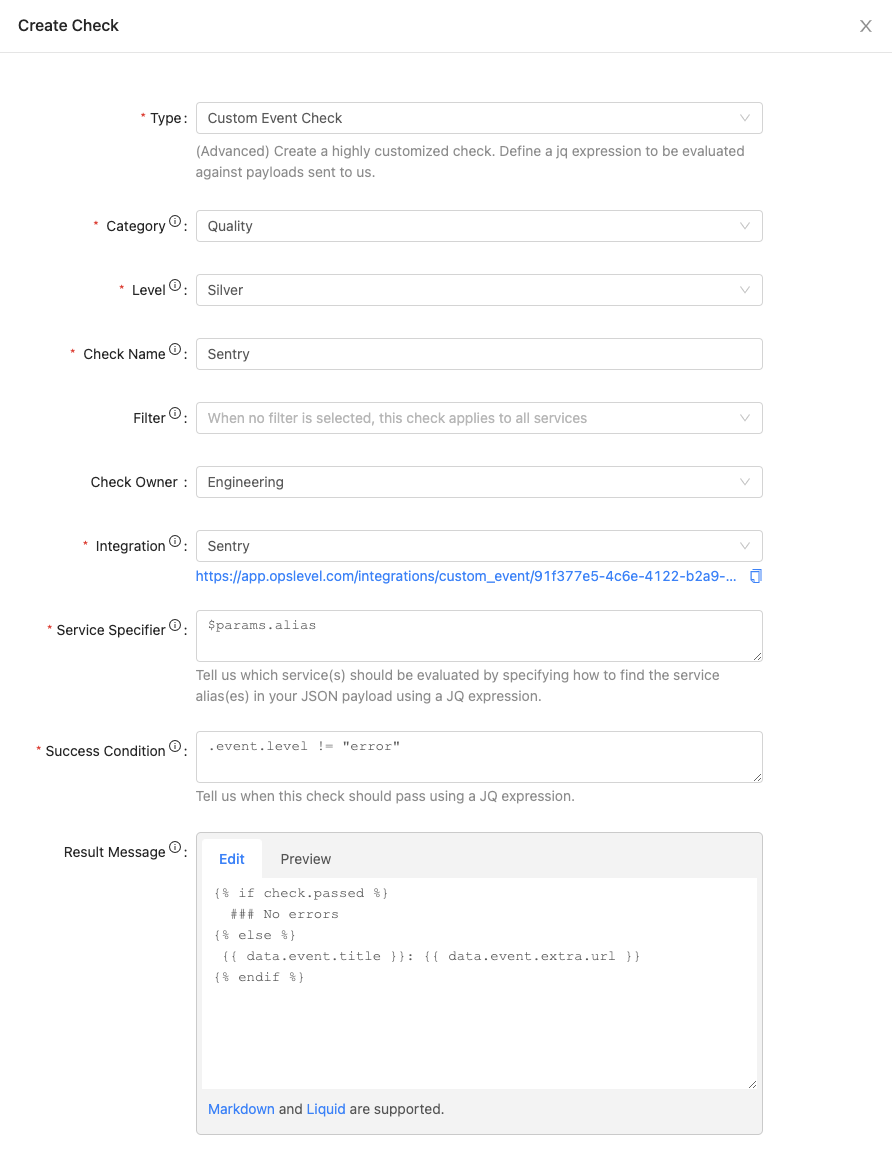
{% endif %}Using URL Query Params: Check for Number of Issues in Sentry
In Sentry you are able to specify a webhook to receive event payloads. To identify the service, we will specify it using query params.
In Sentry, navigate to your project and select Settings > Integrations, then search for “Webhook”. Select it and add it to the project of interest.


In your Sentry project you can configure your Sentry project to send webhooks. In this example we will configure it to send payloads to the custom event integration.

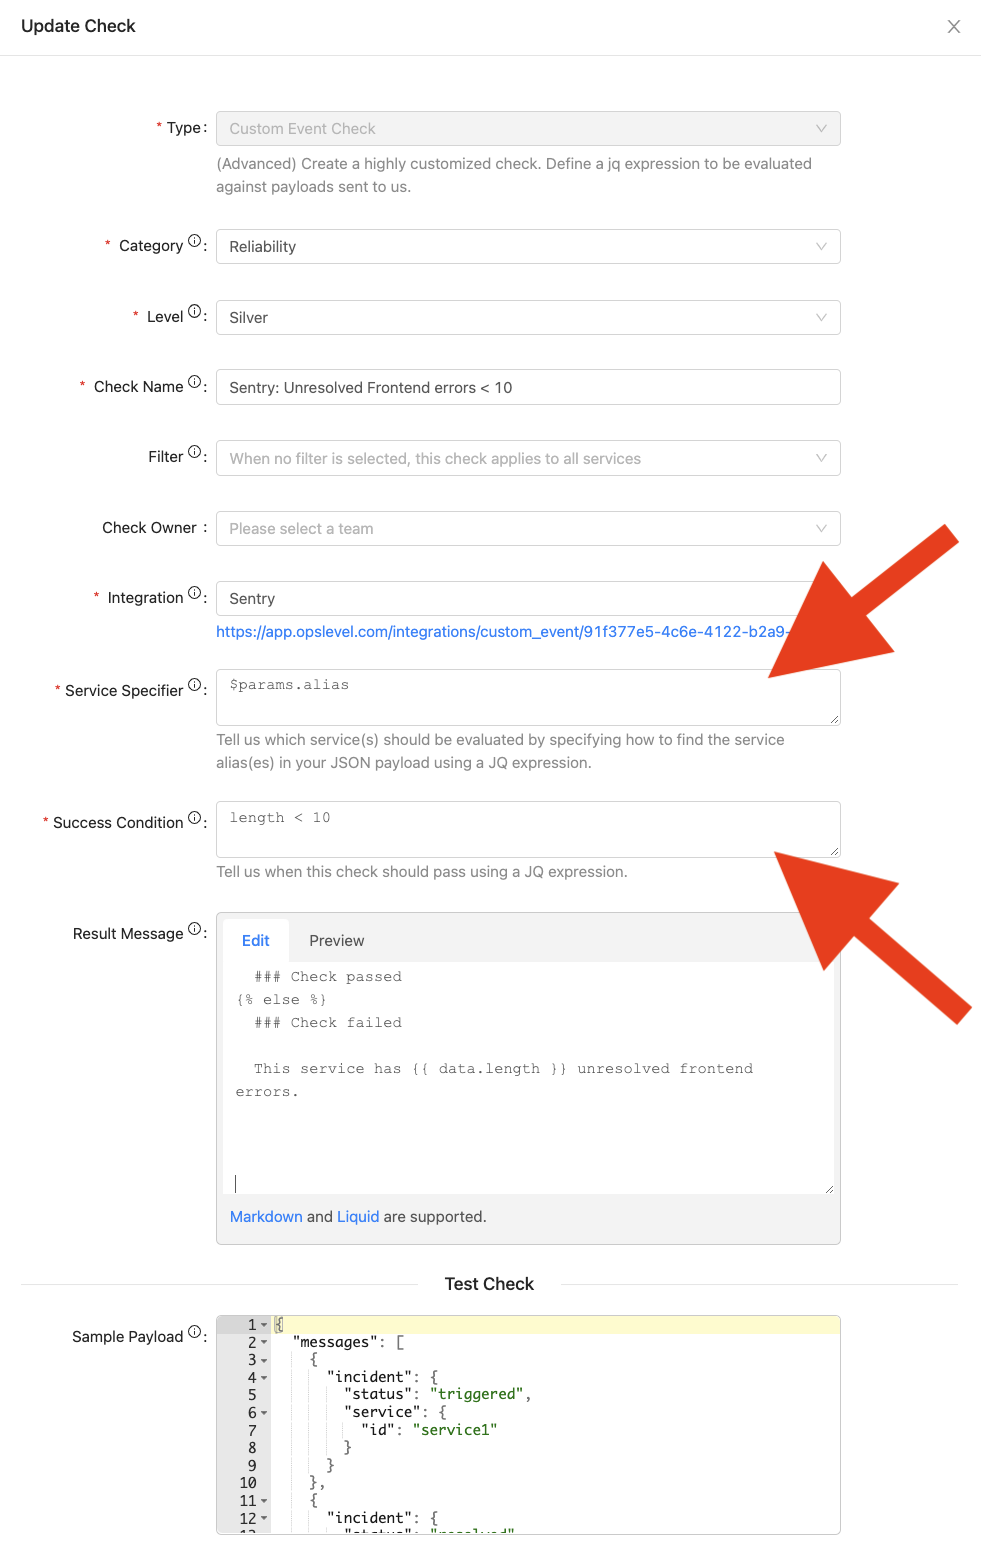
Once this is configured Sentry will begin sending webhooks to OpsLevel. For our check we will use the $params variable in our service specifier.
$params.aliasA completed check will look like:
Custom Check Fields
Service Identifier
When crafting service identifier expression, OpsLevel provides access to your URL query params to help route your check in the scenario where your payload does not include a service alias.
| Variable | Description |
|---|---|
$params | The URL query parameters provided in the POST request sent to the Custom Event Integration endpoint. |
Success Condition
When crafting your success condition, OpsLevel provides access to variables to help specify which part of the payload is relevant to each found service.
| Variable | Description |
|---|---|
$ctx | The context object for each found service alias. |
$ctx.alias | The service alias found in your payload. |
$ctx.index | The index in the list where the service was found. |
$ctx.count | The number of services found. |
$params | The URL query parameters provided in the POST request sent to the Custom Event Integration endpoint. |
Another way of looking at it is that $ctx is an object:
Liquid Templating
When creating custom result messages with Liquid, OpsLevel provides access to variables to help in crafting helpful messages.
Note that the variables in liquid templating do not include a dollar sign ($) at the front.
| Variable | Description |
|---|---|
check | The check object contains information about the check result |
check.passed | A boolean value of whether the check passed. |
check.failed | A boolean value of whether the check failed. |
check.status | A string of the current check status, passed or failed. |
data | The data object gives you access to the payload sent to the OpsLevel Custom Event Integration endpoint. |
ctx | The context object for each found service alias that contains alias, index, and count — just as in the Success Condition |
params | The URL query parameters parameters provided in the POST request sent to the Custom Event Integration endpoint. |
Liquid Filters
Filters are simple expressions you can use to transform text and variables. For example, to generate the string filtrd txt, you can write:
In addition to the default Liquid filters you can use these filters:
| Filter | Description |
|---|---|
where_exp | Select objects matching an expression. Example: {{ data.vulnerabilities | where_exp: "item", "item.cvssScore > 7.0" }} |
group_by | Group an array of objects by a property. Example: {{ data.vulnerabilities | group_by: "severity" }} |
group_by_exp | Group array items using an expression. Example: {{ data.vulnerabilities | group_by_exp: "item", "item.severity != 'critical'" }} |
jsonify | Show data in the JSON format. See the example below. |
safe_get | Returns the value of the provided variable name. If the variable doesn't exist, returns an empty string. Example: {{ 'data.vulnerabilities' | safe_get }} |
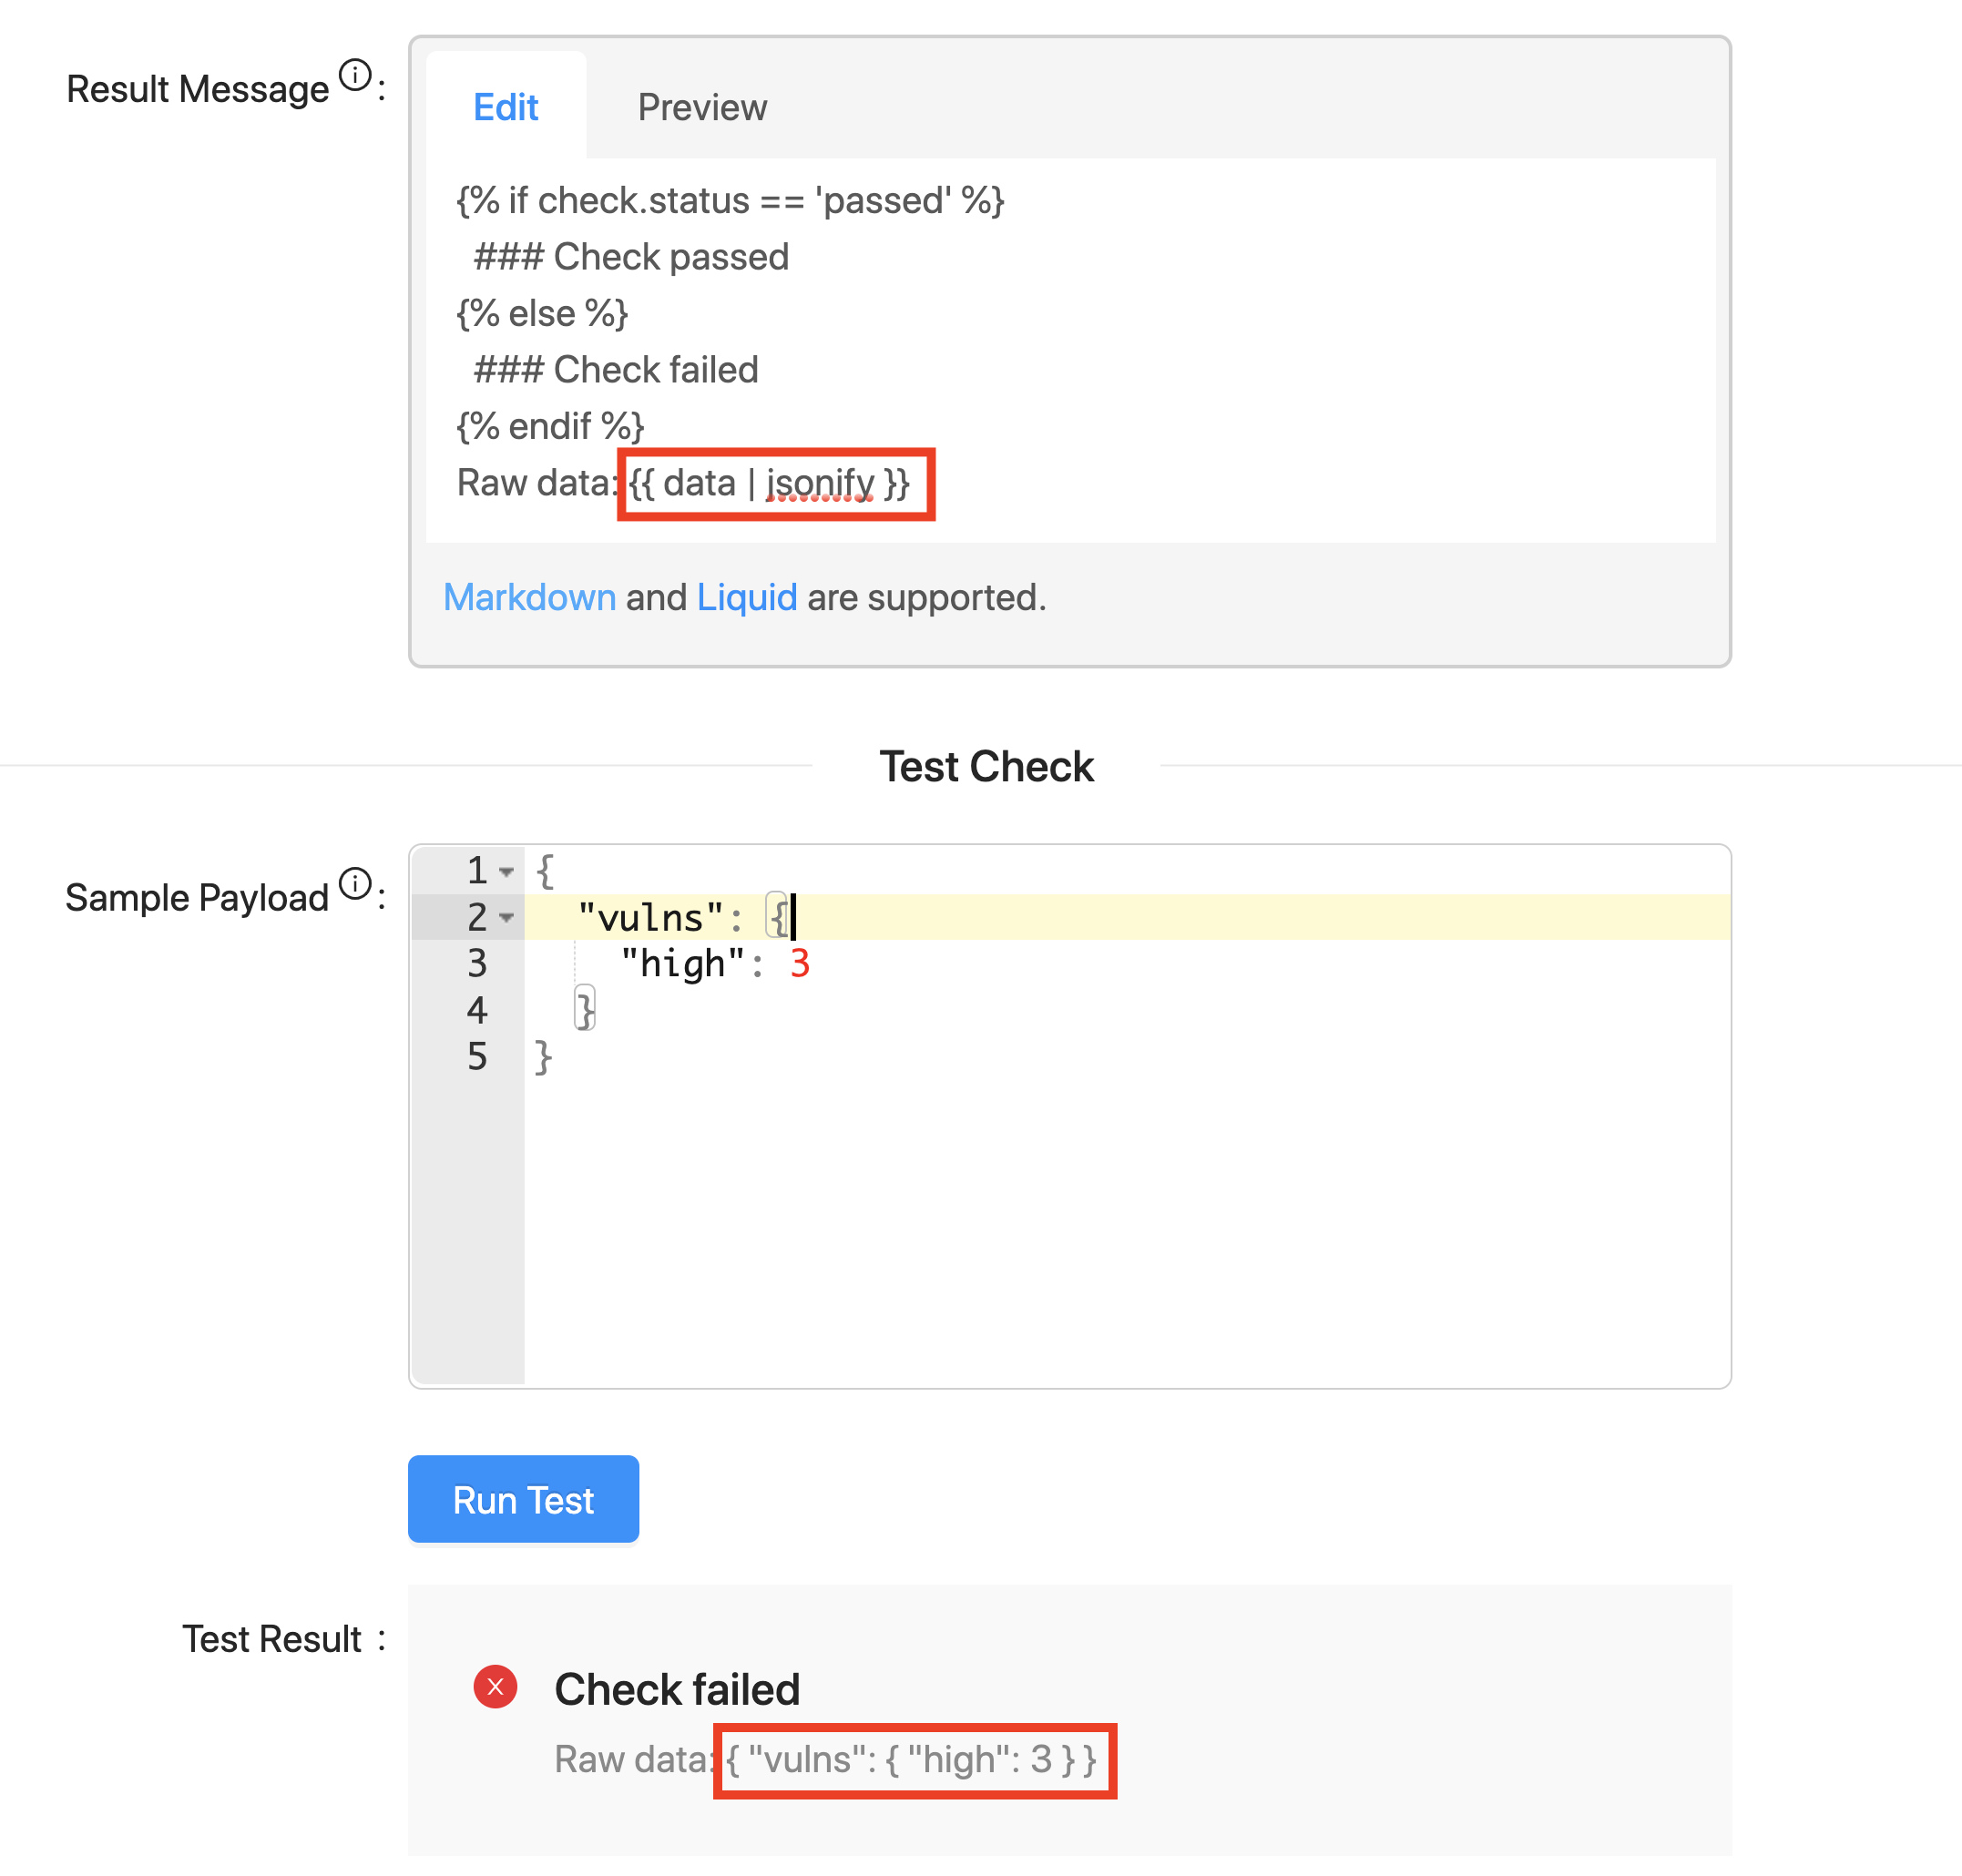
Example: Display the Number of High Vulnerabilities on your Service’s Repositories
In this example, a user wants to evaluate if there are any high criticality vulnerabilities on their service’s repo. They can send a simple JSON payload to OpsLevel:
If there are any high criticality vulnerabilities, we want to show the number of such vulns. Otherwise, if there are zero vulns, we want to show a “Congratulations” message.
The result message template looks like this:
{% if check.passed %}
## Congratulations!
{% else %}
## Critical Vulnerabilities Detected
You have {{ data.vulns.high }} high vulnerabilities.
{% endif %}
Pass Result Message

Fail Result Message

Example: Display Detailed Vulnerability Information about your Service’s Repositories with Snyk
In this example, a user again wants to evaluate if there are any high criticality vulnerabilities on their service’s repo. However, in this case, the JSON payload contains additional detail about each vulnerability that can be shown on the check result message.
Using the Snyk API, a user can get detailed information about each vulnerability and send it to OpsLevel:
The user can add the following jq expression to check if there are any high vulnerabilities:
[ .results | .[] | select(.issue.severity == "high") ] | length == 0Then the user can use the following Liquid template to show a result message with information about how to resolve each vulnerability:
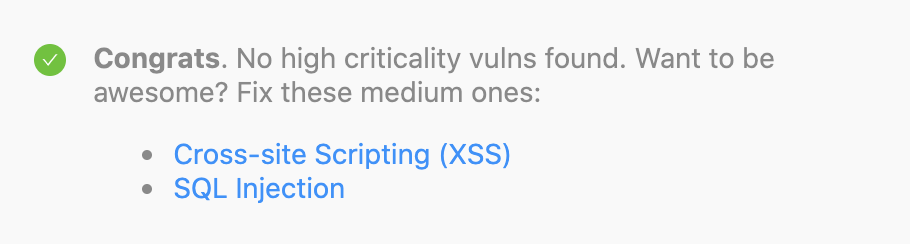
{%- if check.status == 'passed' %}
**Congrats**. No high criticality vulns found.
{%- assign medium_vulns = data.results | map: "issue" | where: "severity", "medium" %}
{%- if medium_vulns.size > 0 %}
Want to be awesome? Fix these medium ones:
{%- for vuln in medium_vulns %}
- [{{vuln.title}}]({{vuln.url}})
{%- endfor %}
{%- endif %}
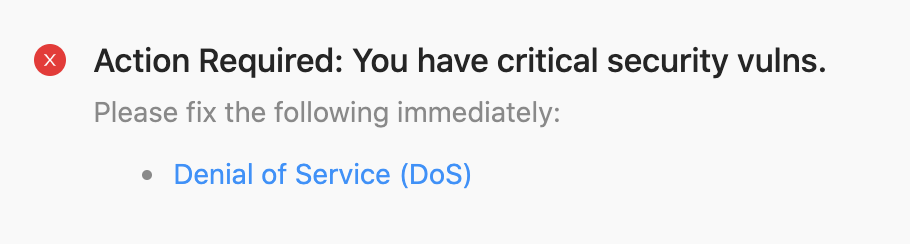
{%- else %}
### Action Required: You have critical security vulns.
Please fix the following immediately:
{%- assign high_vulns = data.results | map: "issue" | where: "severity", "high" %}
{%- for vuln in high_vulns %}
- [{{vuln.title}}]({{vuln.url}})
{%- endfor %}
{% endif %}Pass Result Message
Fail Result Message
Liquid Error Messages
When authoring templates in Liquid, you may experience one of the following Liquid related error messages. OpsLevel uses strict variables and strict filters in Liquid template rendering.
| Title | Message | Description |
|---|---|---|
| Liquid Error | undefined variable | One of the variables used in the Liquid template is not available. This can happen if the variable is not sent as part of the JSON payload (e.g., You refer to {{ data.does_not_exist }}).To check for existence of a variable, use {% if {{ data }} contains "variable" %} instead of {% if data.variable %} |
| Liquid Error | undefined filter | One of the filters used in the Liquid template is not available. See the filters section above for info on available filters. |
| Liquid syntax error | varies depending on the error that occurred | The Liquid template provided is syntactically invalid. Please refer to the official Liquid documentation to try and resolve this error. |
Importing and Exporting Custom Event Checks
Another way that custom event checks can be created is through our Import Check feature.
Exporting
Custom event checks can be defined using a YAML file. You can export a YAML file directly from any of your custom event checks by clicking on Download Check Config from the dropdown menu of the check card.
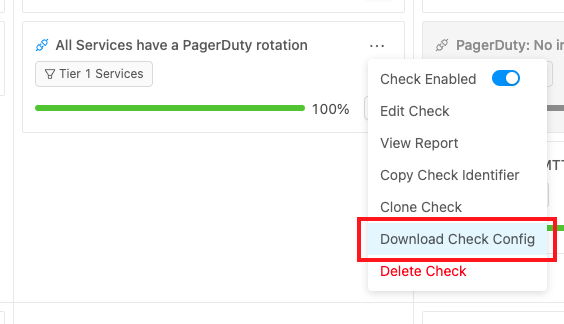
From here, you will have the option to either download or copy the YAML file that defines that specific check.
Importing
To create a custom event check from a YAML file, click on the Import Check button from the Rubric page.

Here you can import or directly paste a YAML file into the text box. After importing, the create check modal will be opened and populated with the check details specified in the YAML. You will need to make sure to specify the integration the check belongs to as well as the Level and Category the check should belong to before you can create the check.
Example of a Custom Event Check Config
The following table defines the properties supported in a custom event check YAML:
Updated 15 days ago