Component Maturity Report
Understand how your components and teams are performing against your rubric.
The Component Maturity Report page provides a global view of how all your teams/services are performing against the rubric. You will be able to answer questions like:
- Which teams are performing the best/worst?
- How are components doing in the Security category?
- Which of our Tier 1 components at the most at risk?
To view the Components Maturity Report, click the Component Maturity menu under the Reports menu.
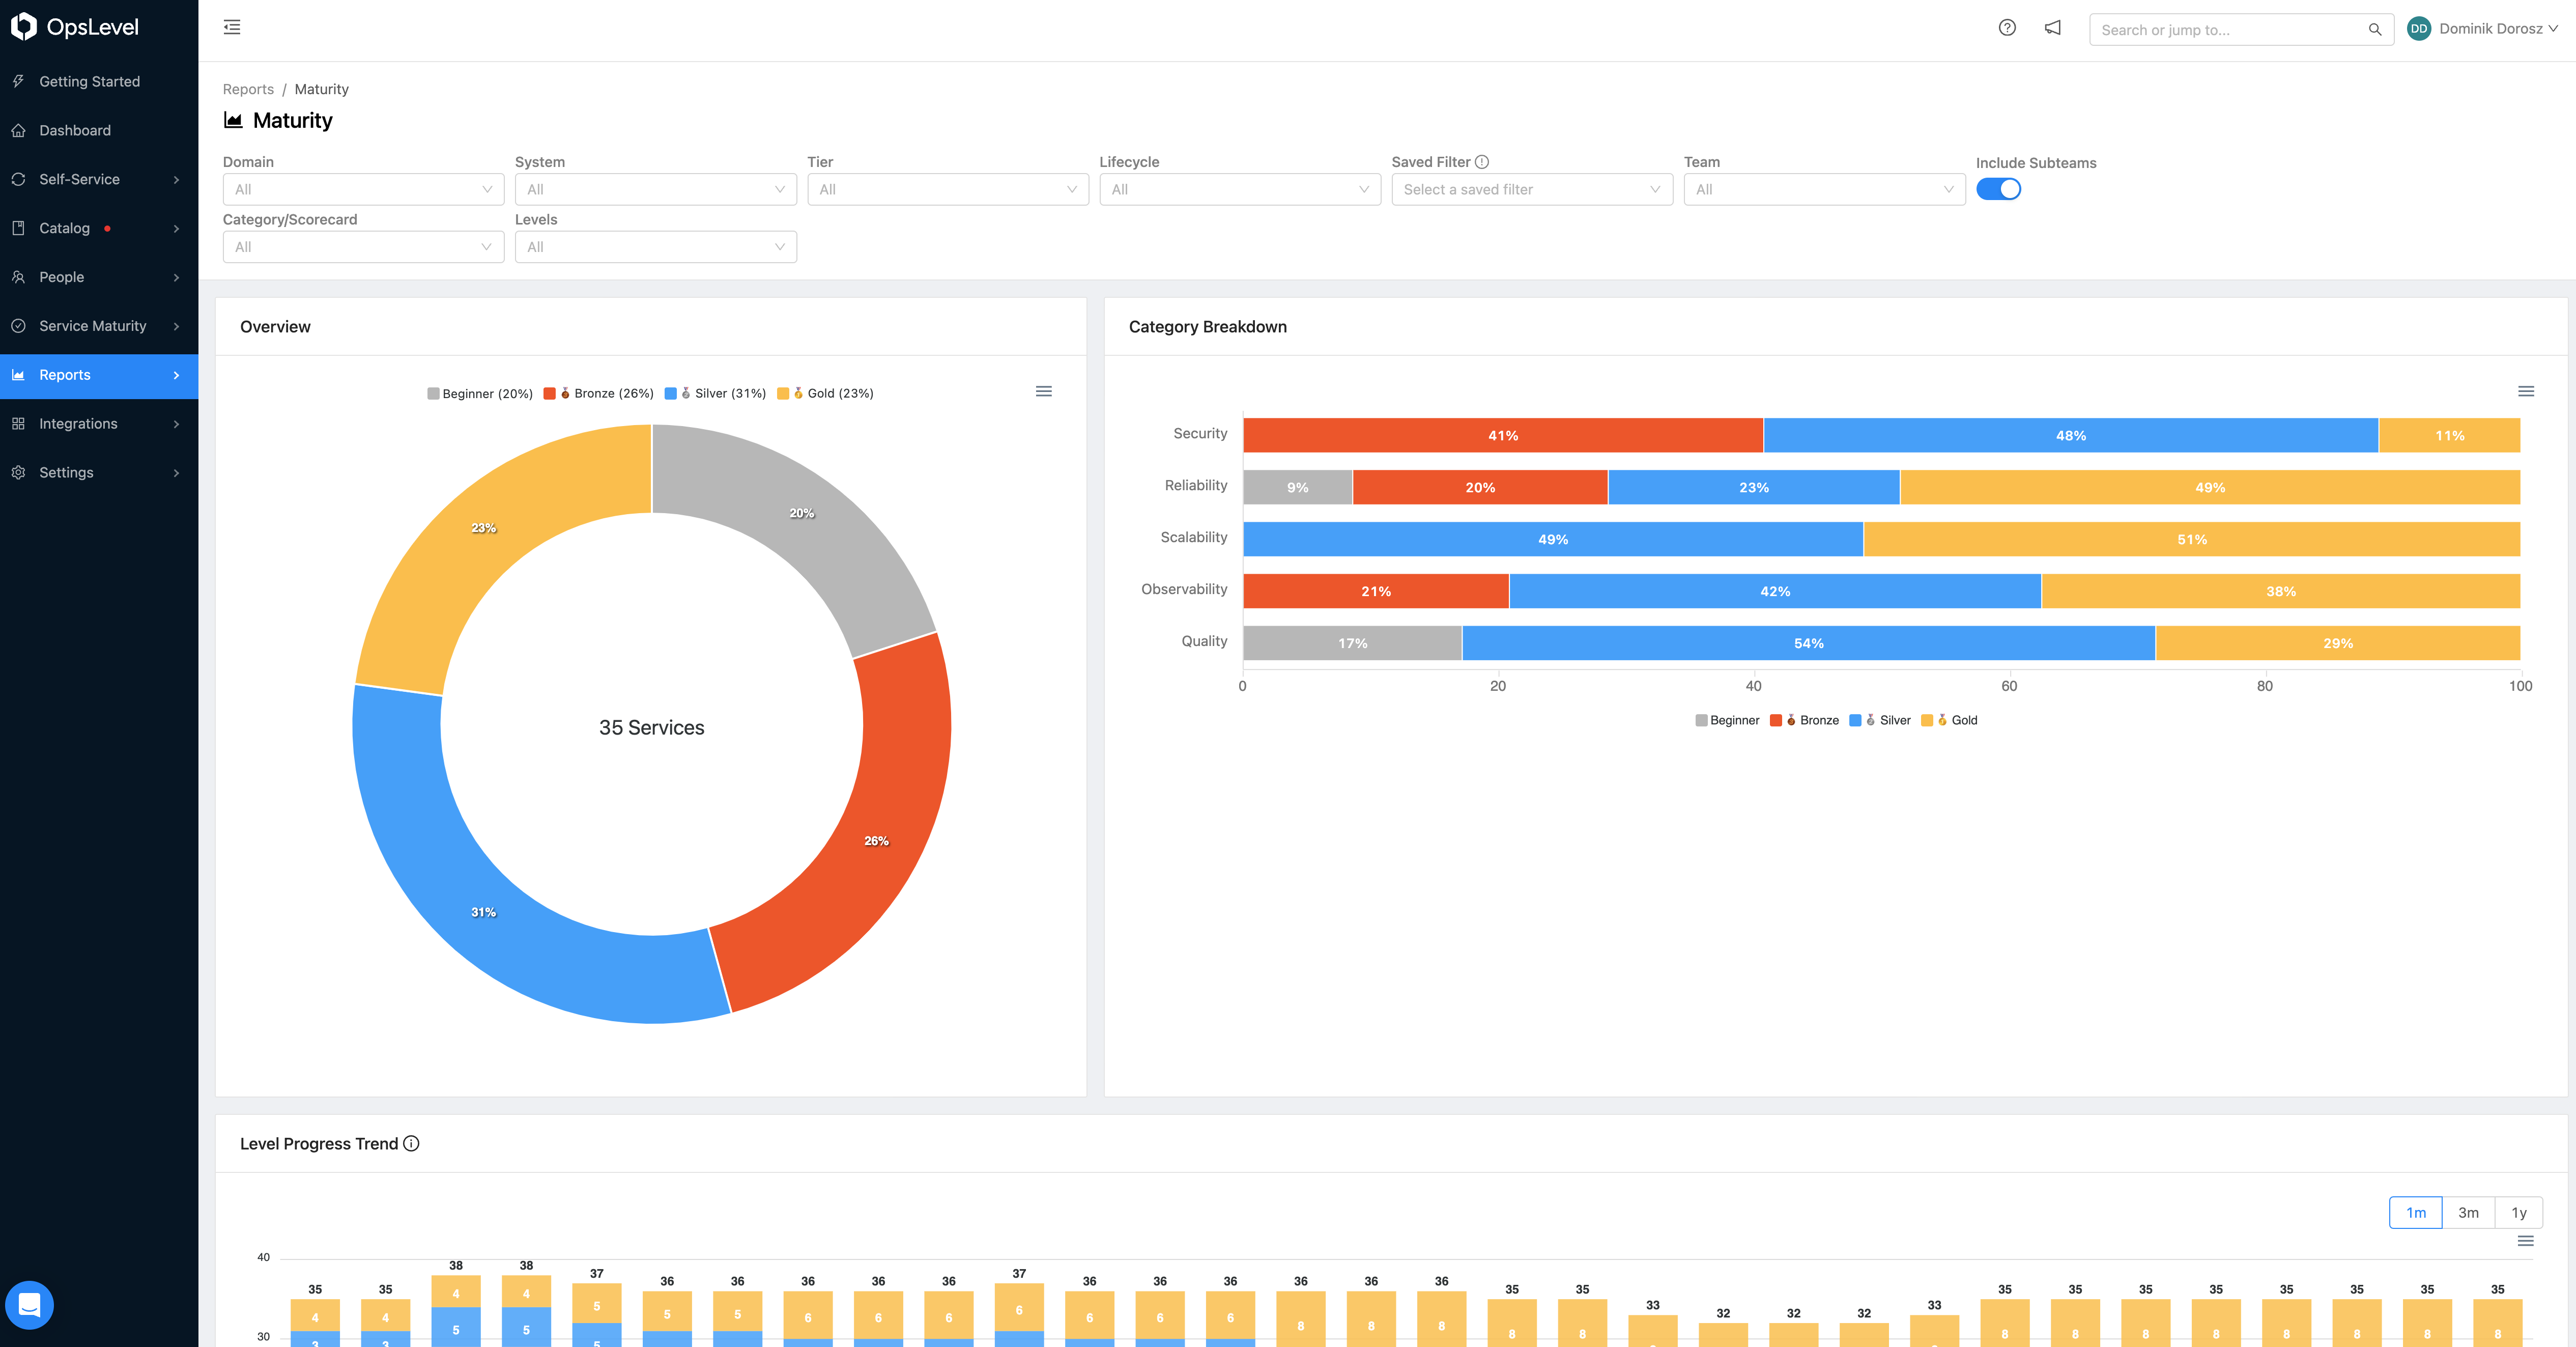
Component Maturity Report Page
Charts
Component Level Overview
The Overview chart shows how many components are in each level. Hovering over a section will display the number of components in that level.
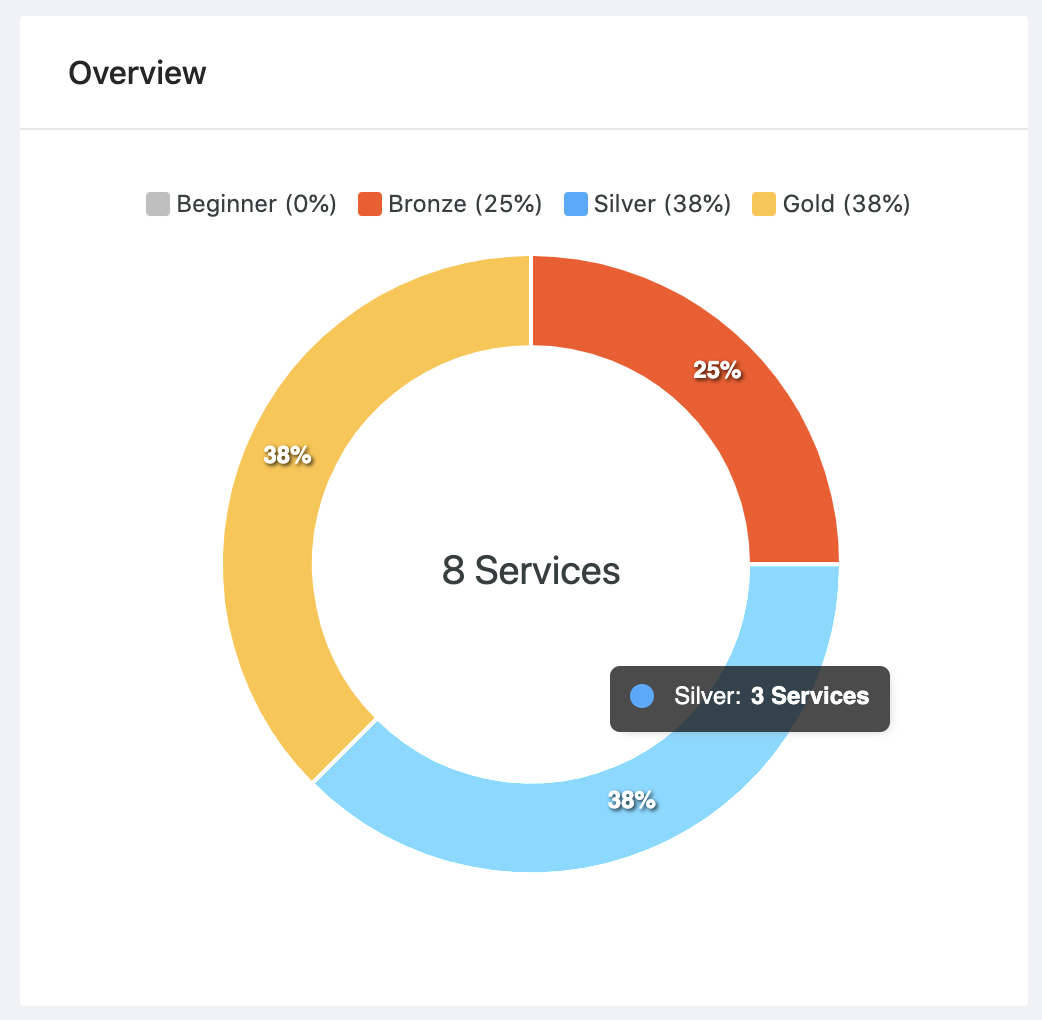
Component Level Overview Chart
Category Breakdown
The Category Breakdown chart groups the components by category and shows how many components are in each level. It can be used to identify how components are performing in each category.
In this example, components are doing great in the Quality category with 88% of components being in the Gold level, and performing poorly in the Security category with 40% in the Bronze level. Hovering over a section will show the number of components in a certain level and category.
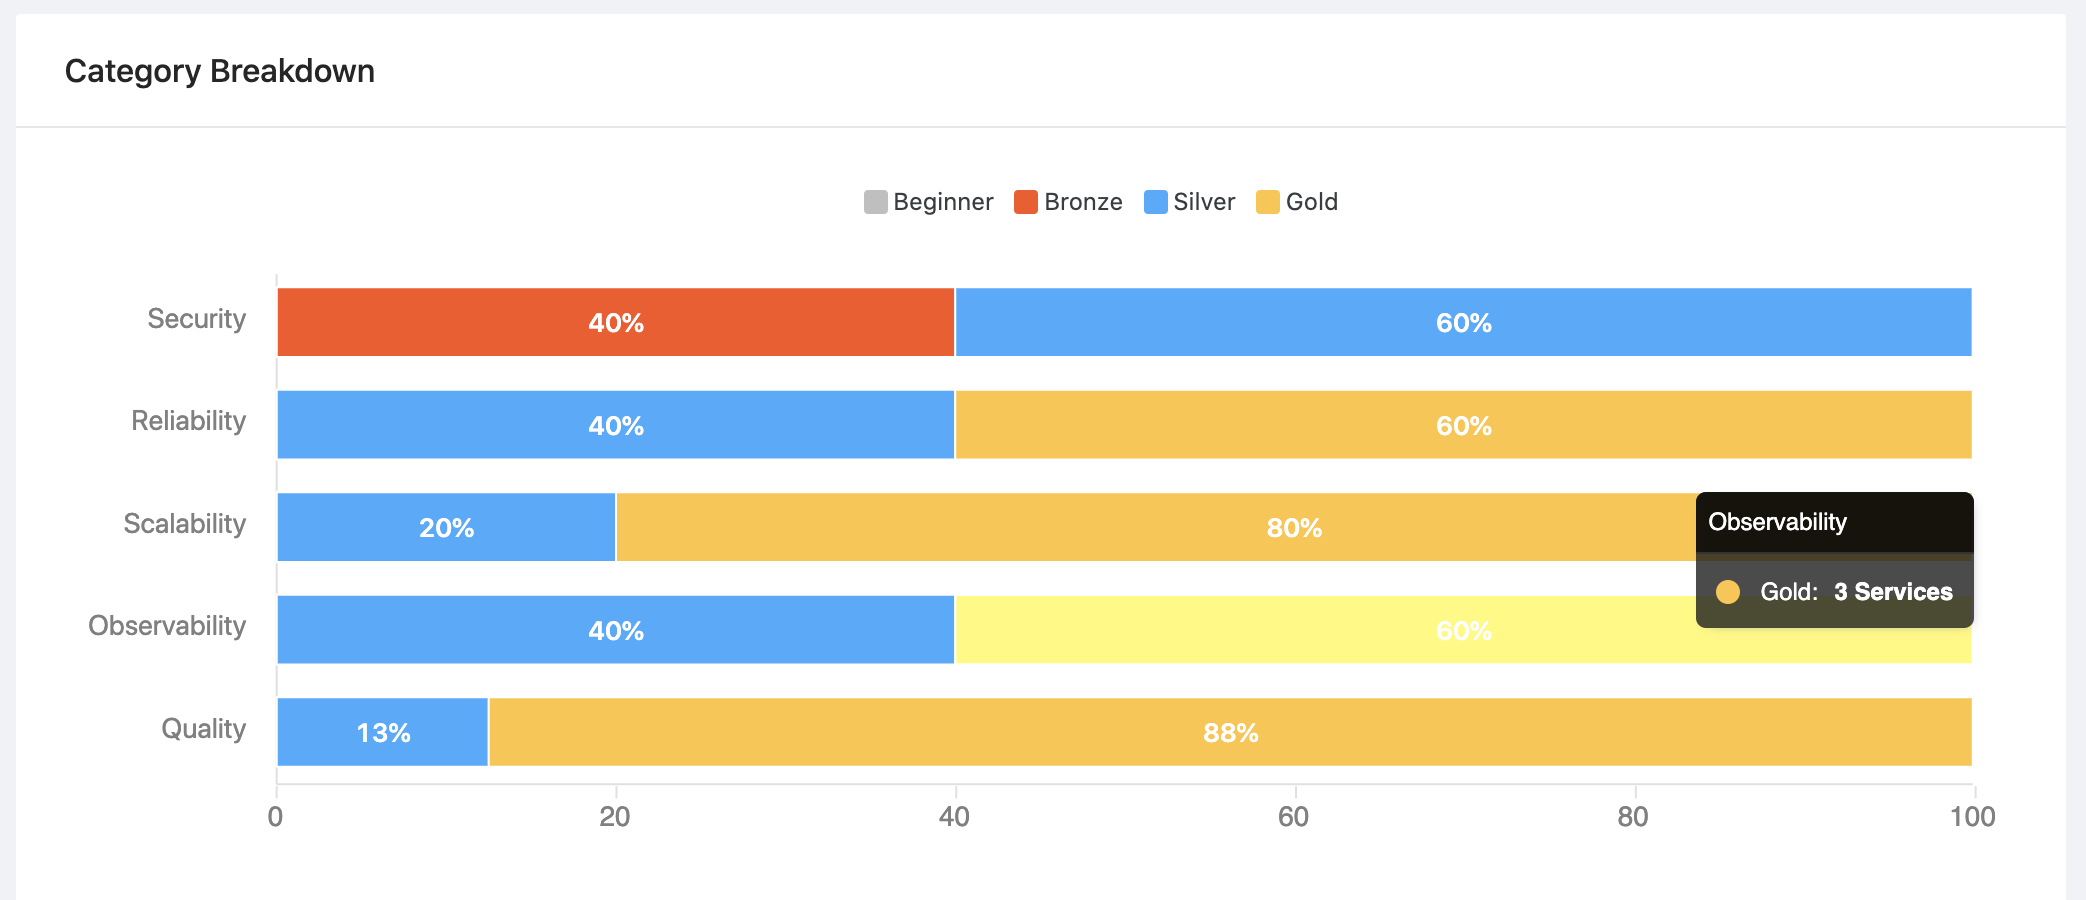
Category Breakdown Chart
Level Progress Trend Chart
The Level Progress Trend chart provides a timeline of how the Component Maturity in your organization is progressing.
This chart adheres to the filters set in the page header and can also be viewed for various time ranges. Depending on the time range selected, a different grouping (or resolution) will be used in the chart:
- 1m = Daily view over the past month
- 3m = Weekly view over the past 3 months
- 1y = Monthly view over the past year
Using the filters and ranges, you can whittle down the components you care to view trends for. This can help you answer questions such as, "Is the organization moving in the right direction?", "Which categories are causing the biggest issues?", and "Which teams are struggling or excelling the most?", among many others.
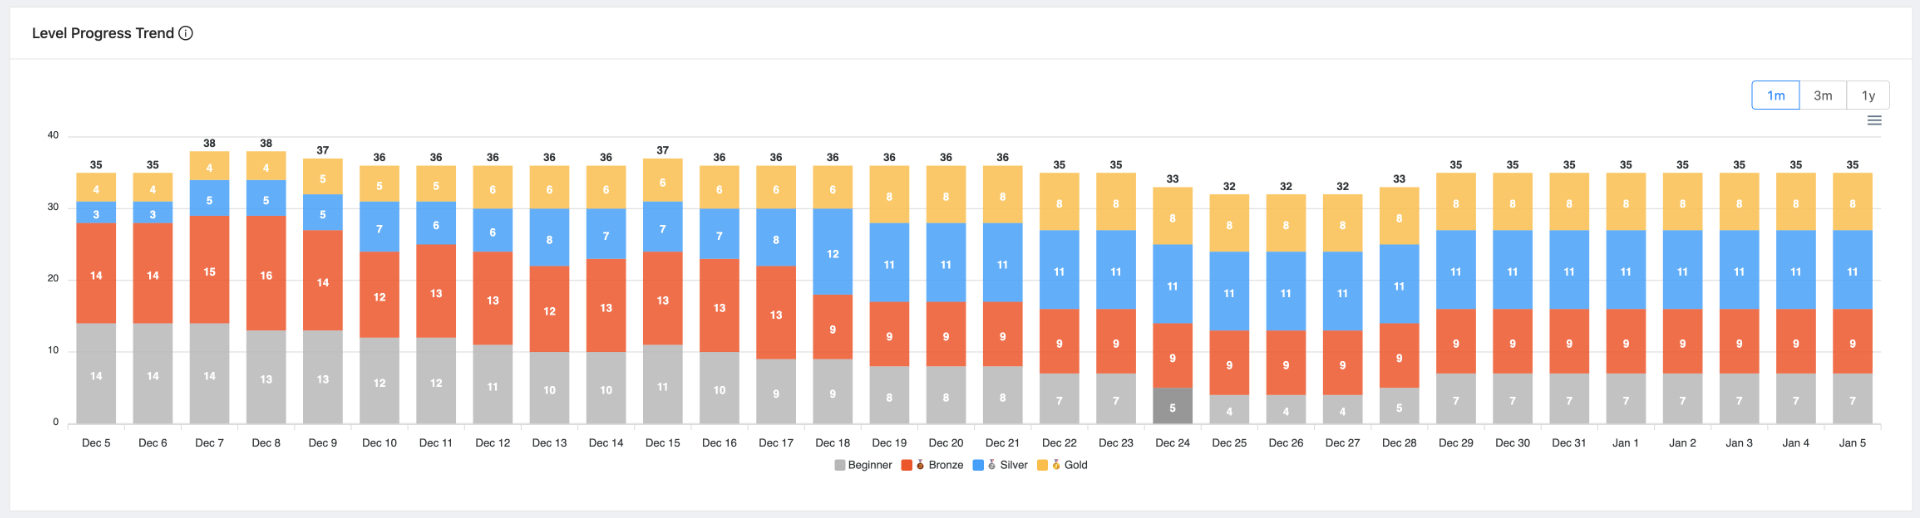
Level Progress Trend Chart
Report
The Report section groups components by team which allows you to see how each team is performing against the rubric. The values display how many components owned by that team are in each level.
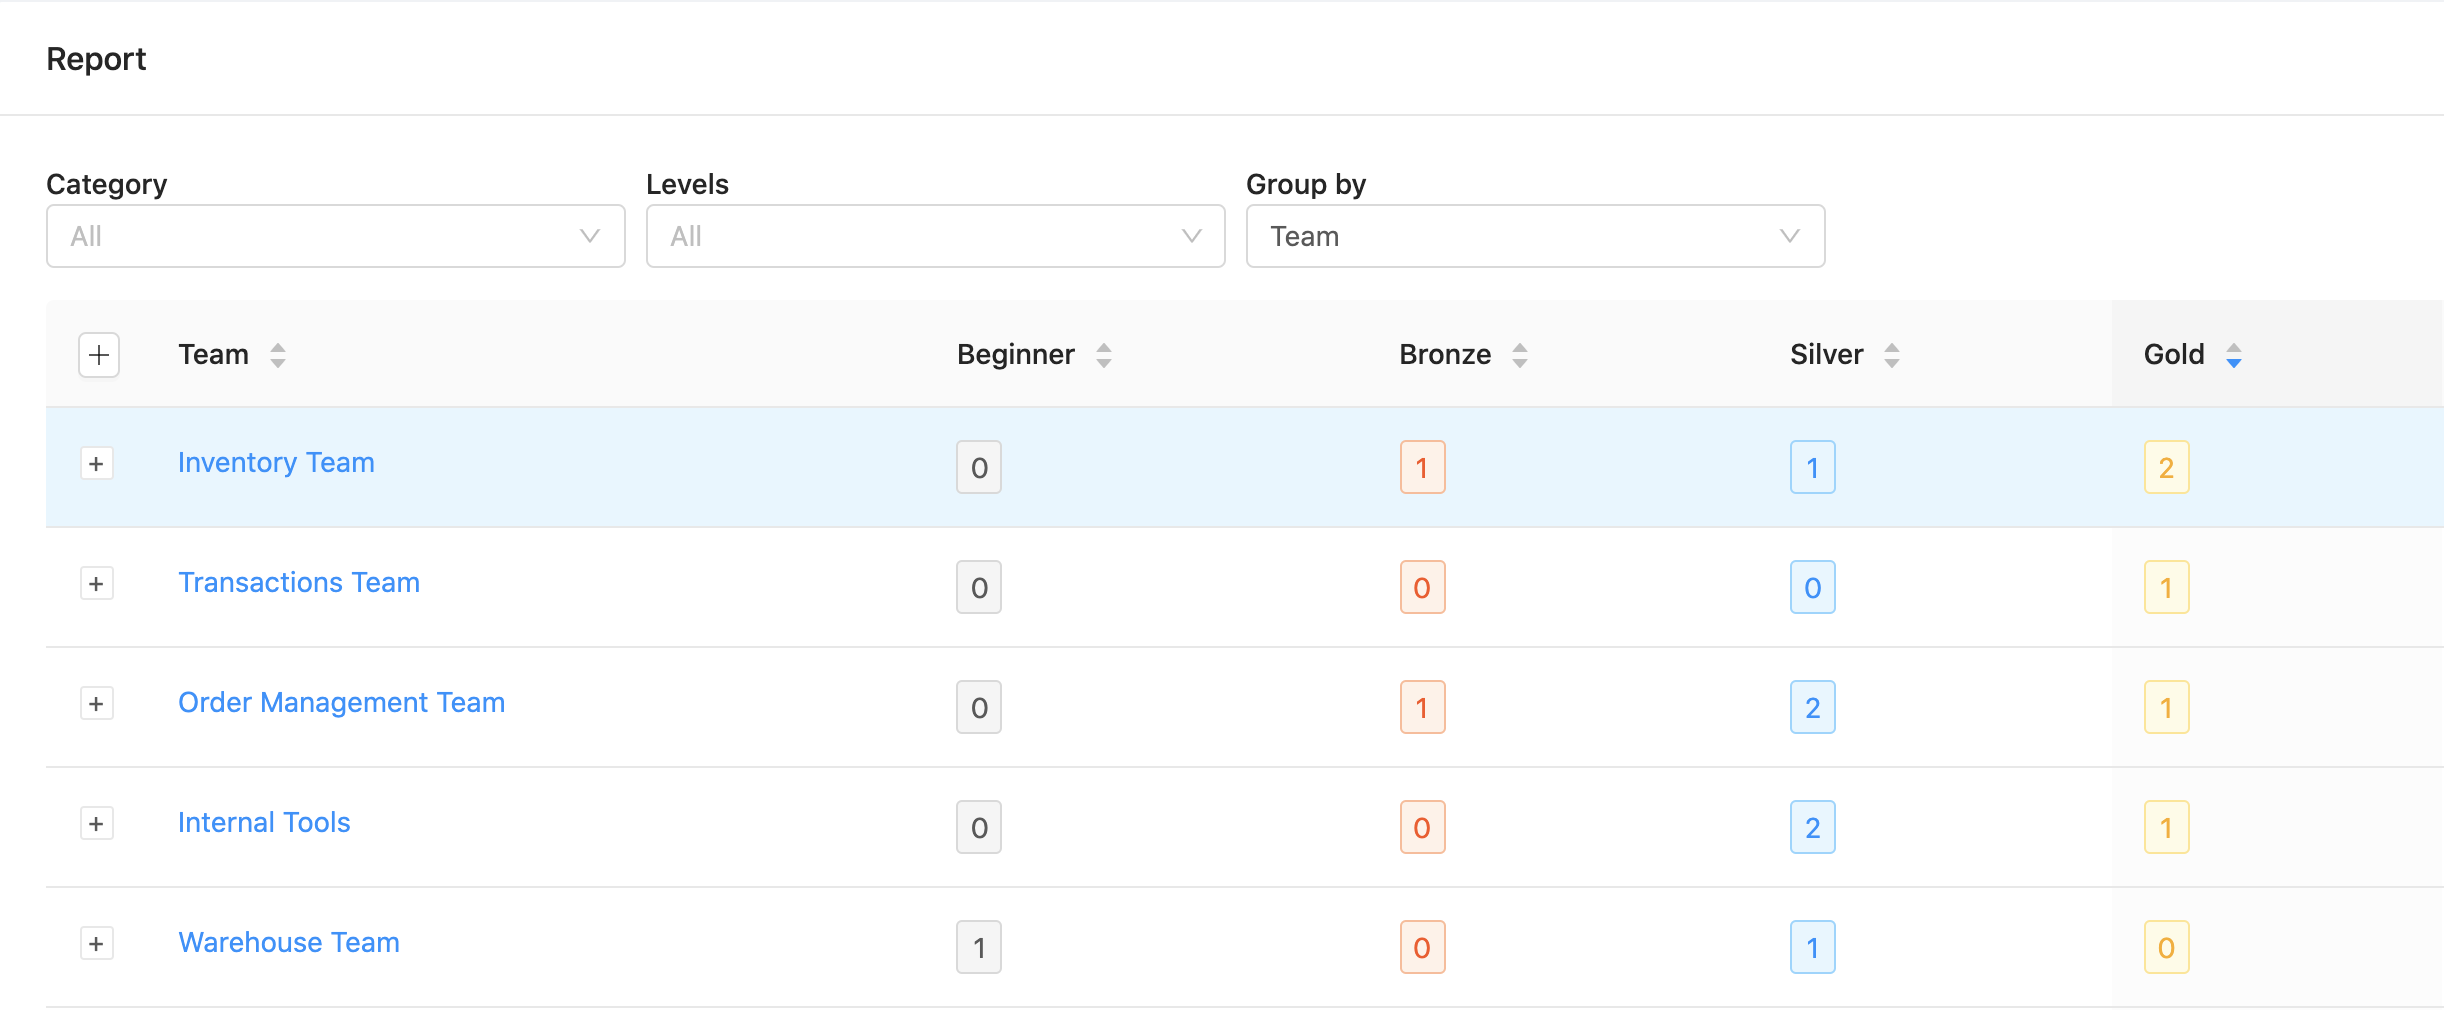
Component Maturity Report
In this example, the Inventory Team is doing well - it has 0 components in Beginner and 2 in Gold. The Warehouse team on the other hand is doing poorly - they have 1 component in Beginner and 0 in Gold.
Clicking on the + icon beside a team’s name will show how that team’s components are performing against the rubric. The Level column displays the component's current level. Clicking on the component's level will take you the Maturity Report tab where you can learn more about why that component was assigned a certain level.
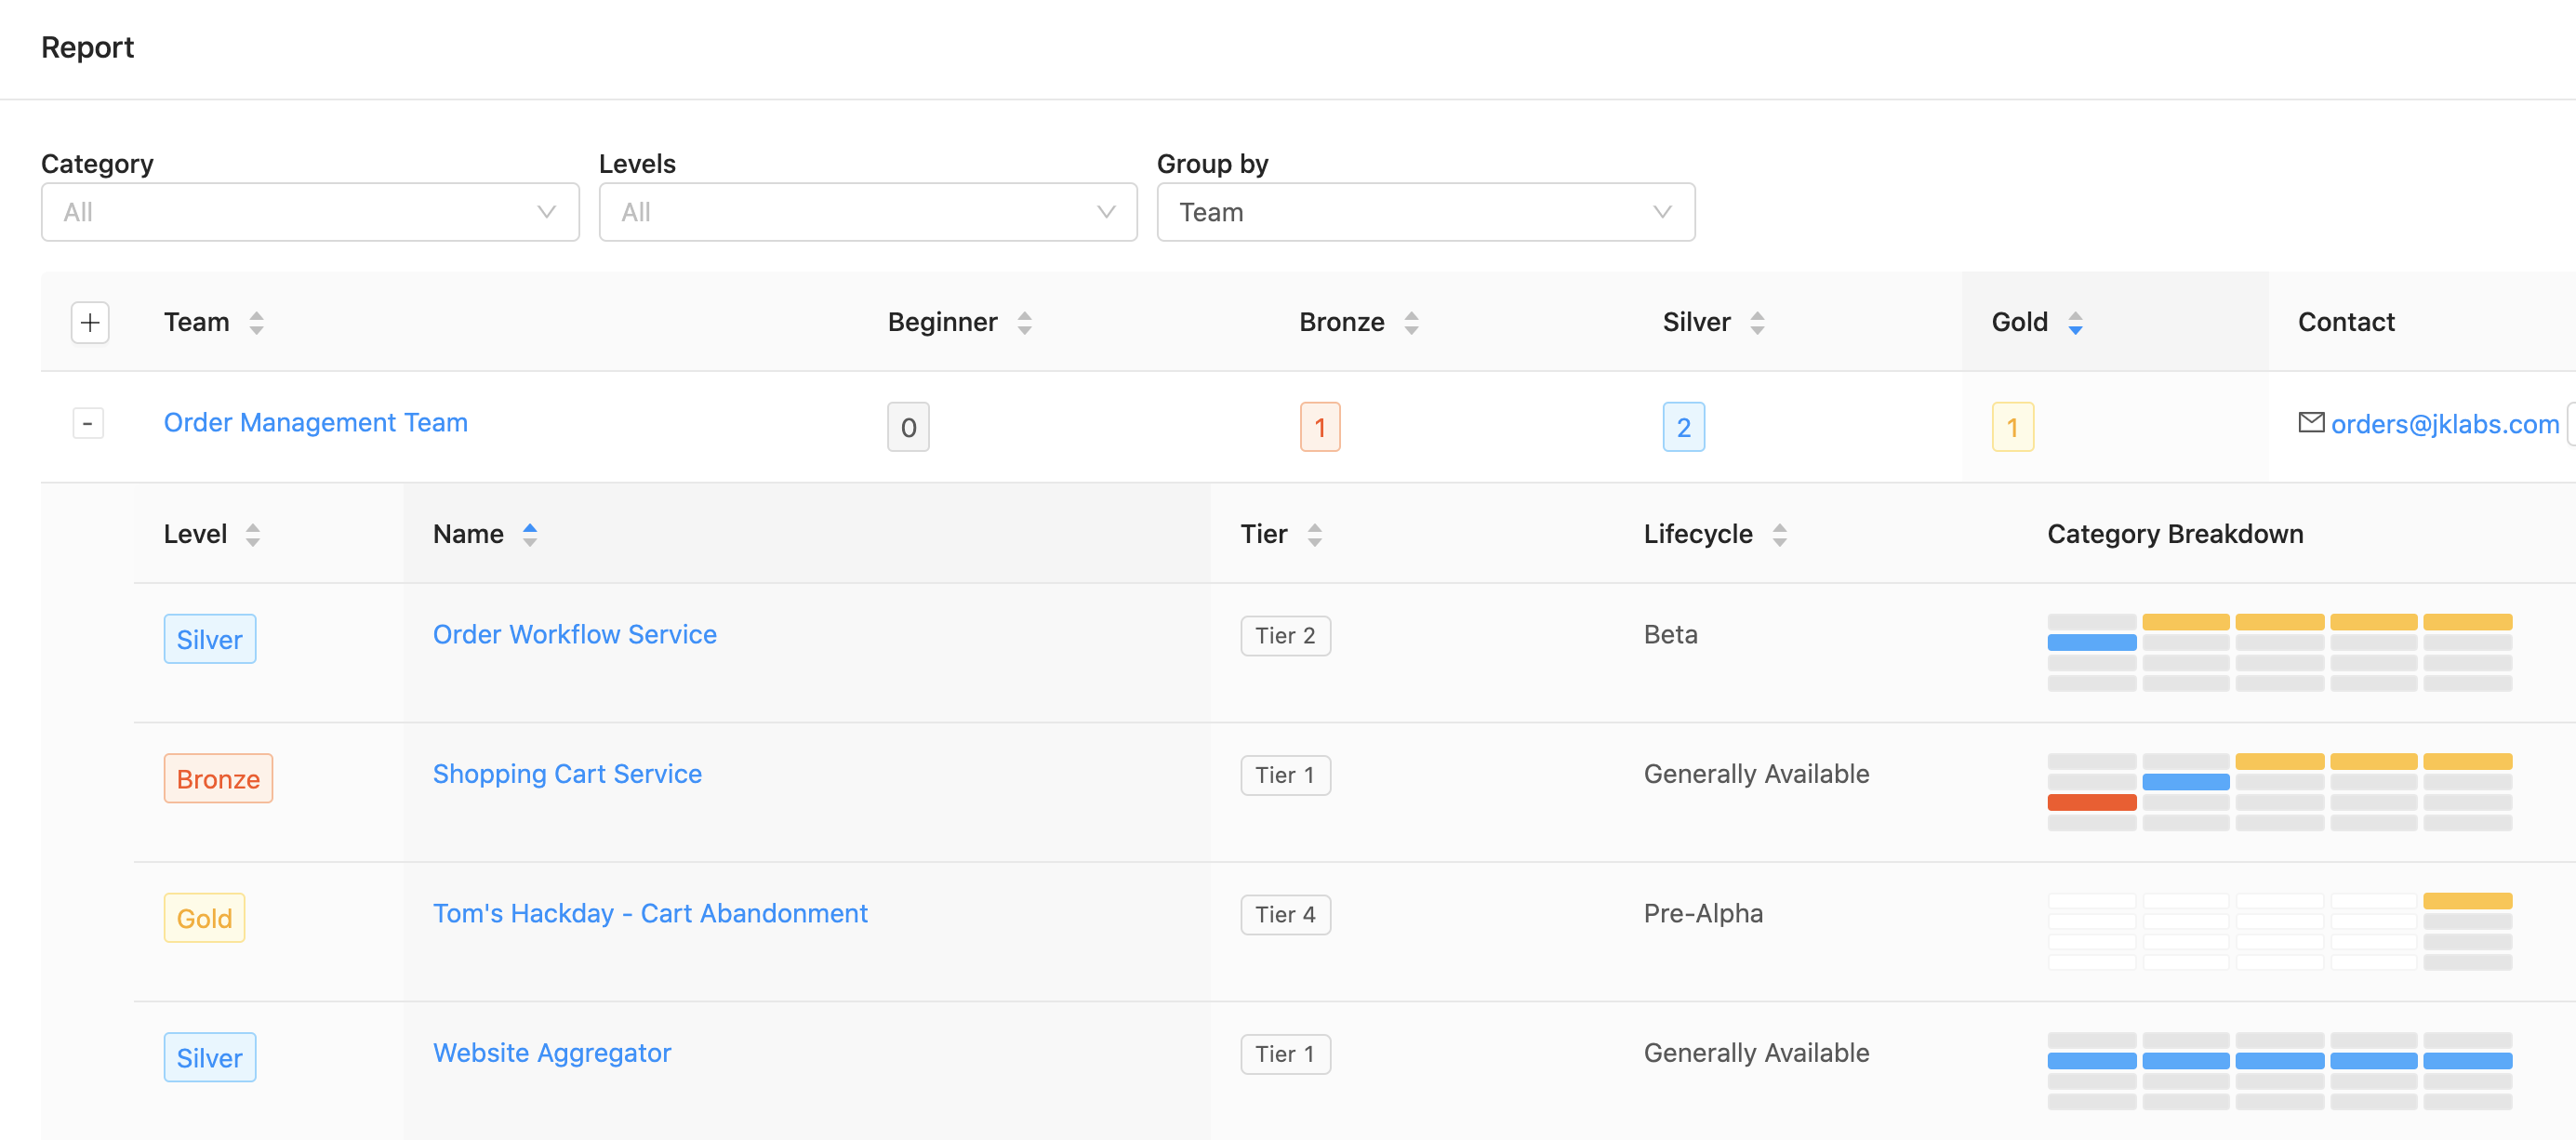
Component Maturity Report Group By Team
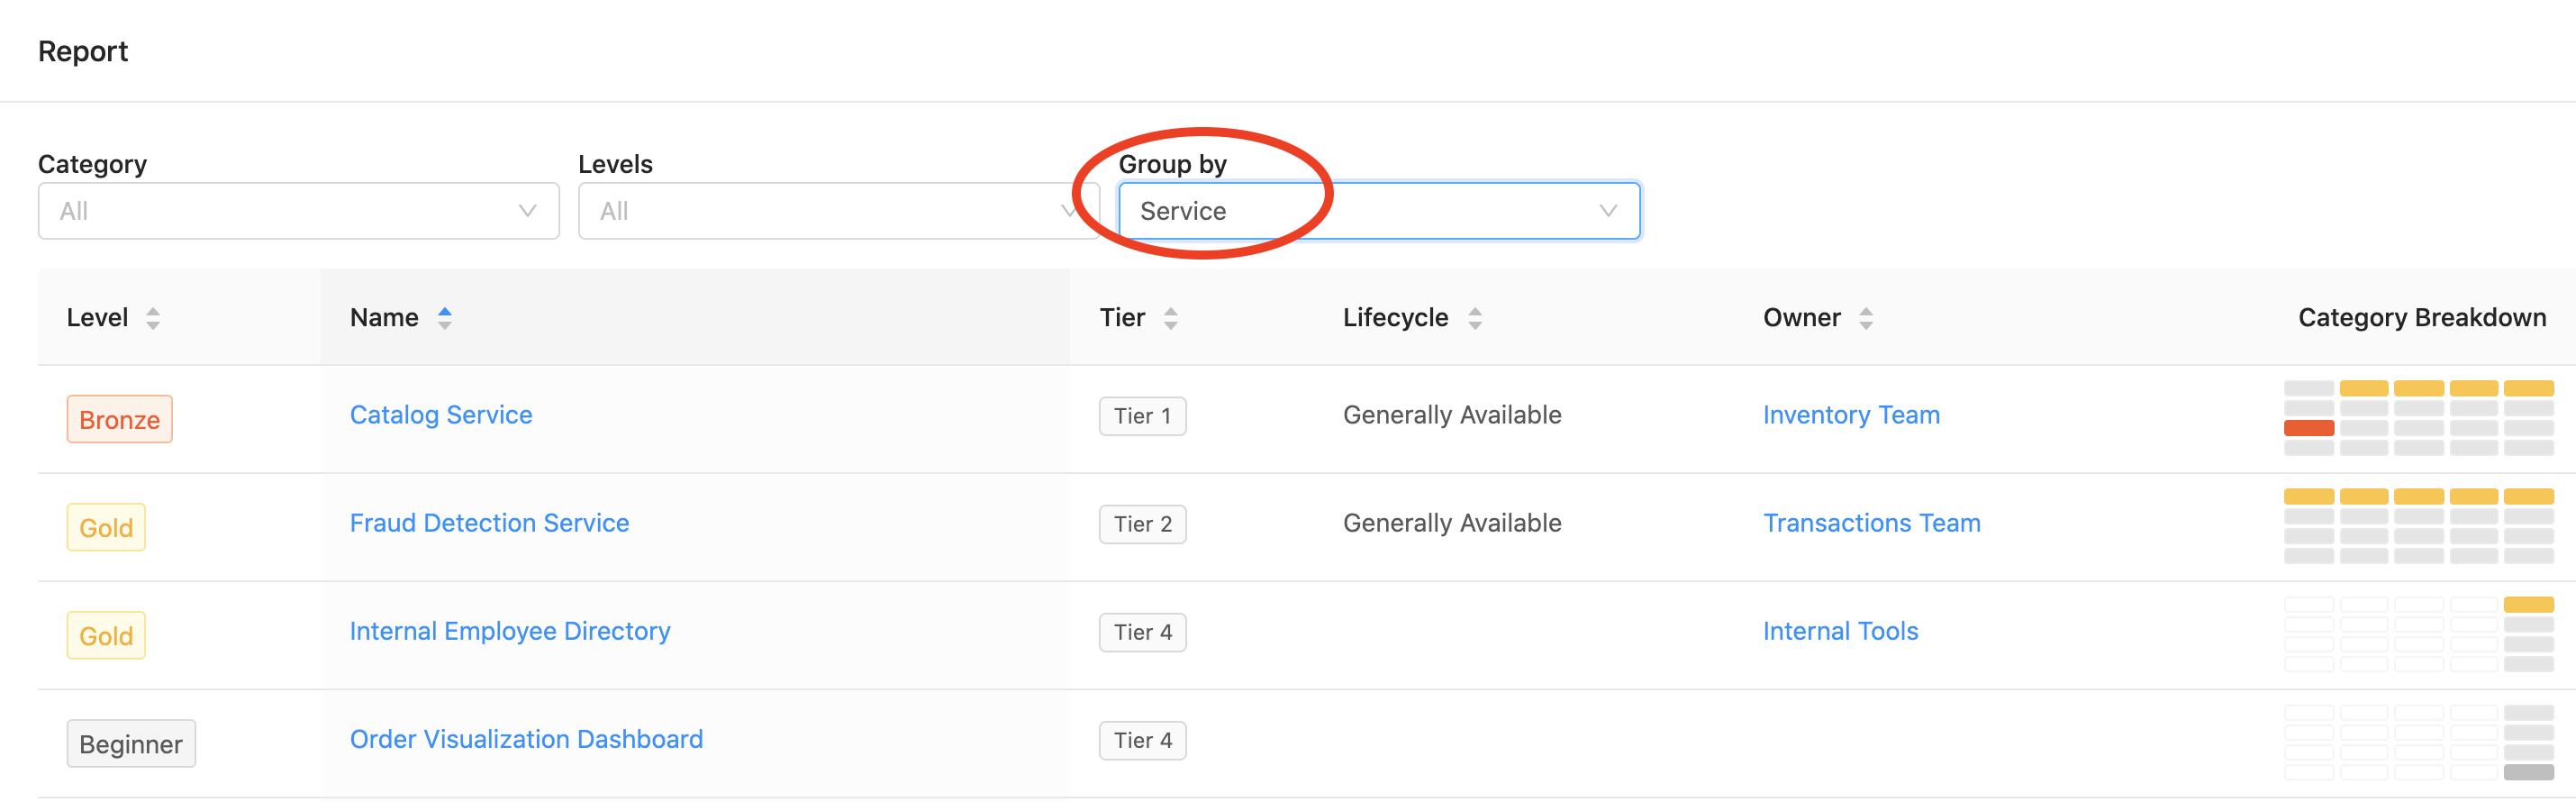
The last column entitled Category Breakdown shows how a component is performing against the different categories. The categories are shown as columns and the levels are shown as rows.
You can figure out at a glance why a component has a certain level. For example, the Order Workflow Component has a level of Silver in the Security category which is bringing down its overall level to Silver. Once the component achieves Gold in Security, its overall level will also move up to Gold.
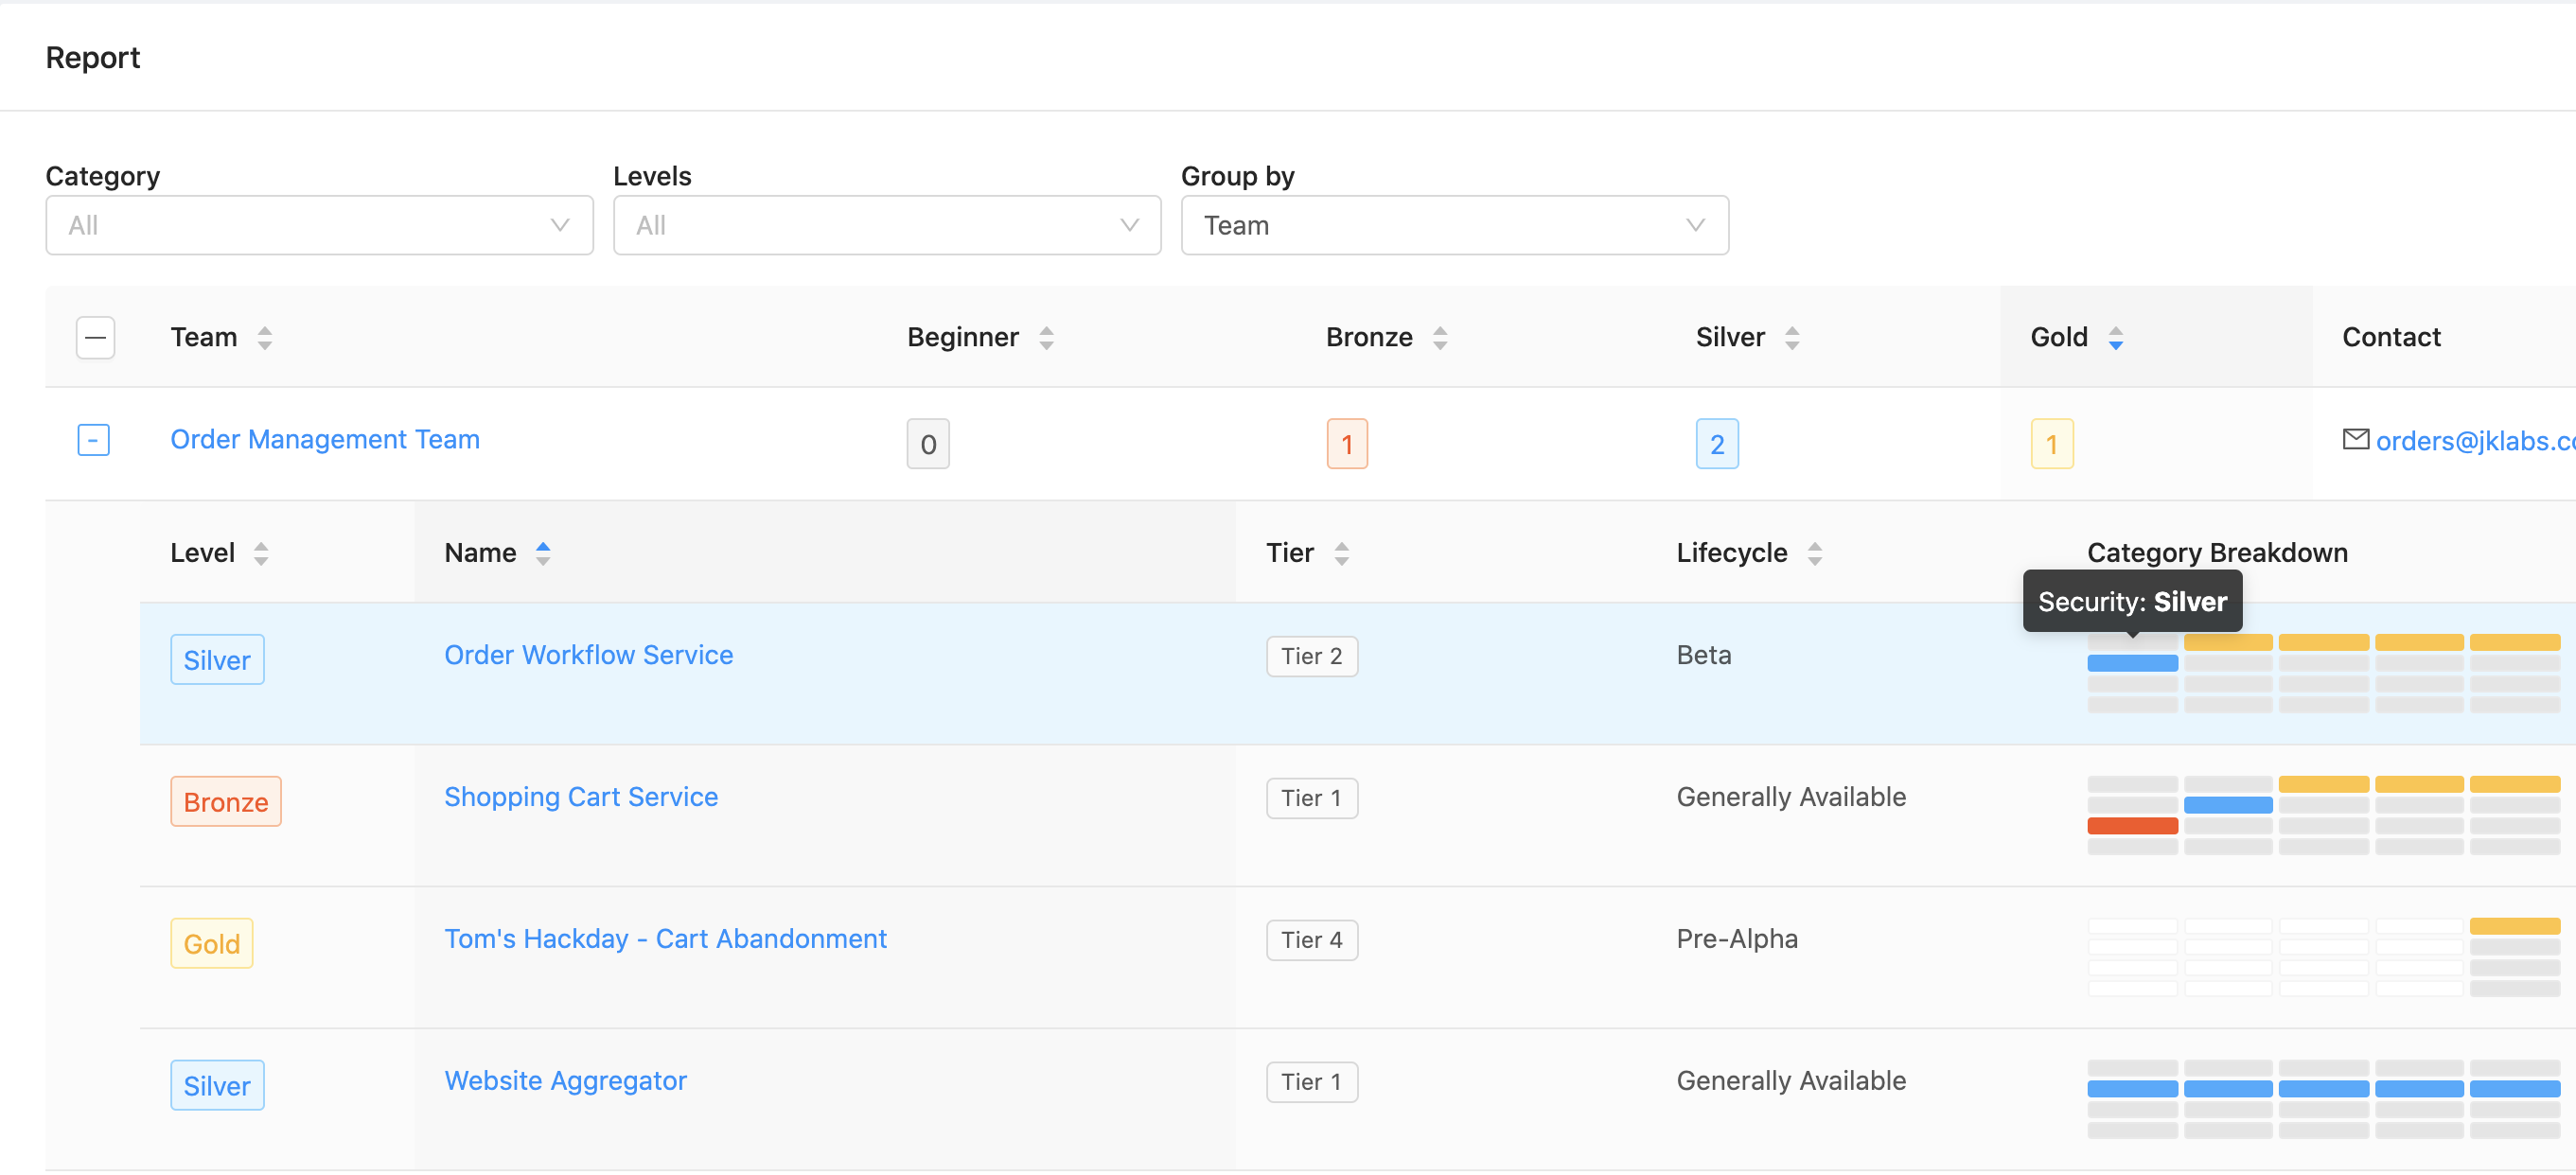
Component Maturity Report Group By Team Category
White cells in the Category Breakdown indicate that a component doesn’t have a level for that category. Hovering over the cell will show a level of "N/A". This can happen if all the checks for a category are using filters that don’t apply to the component. You can read the Checks and Filters docs for more info about filters.
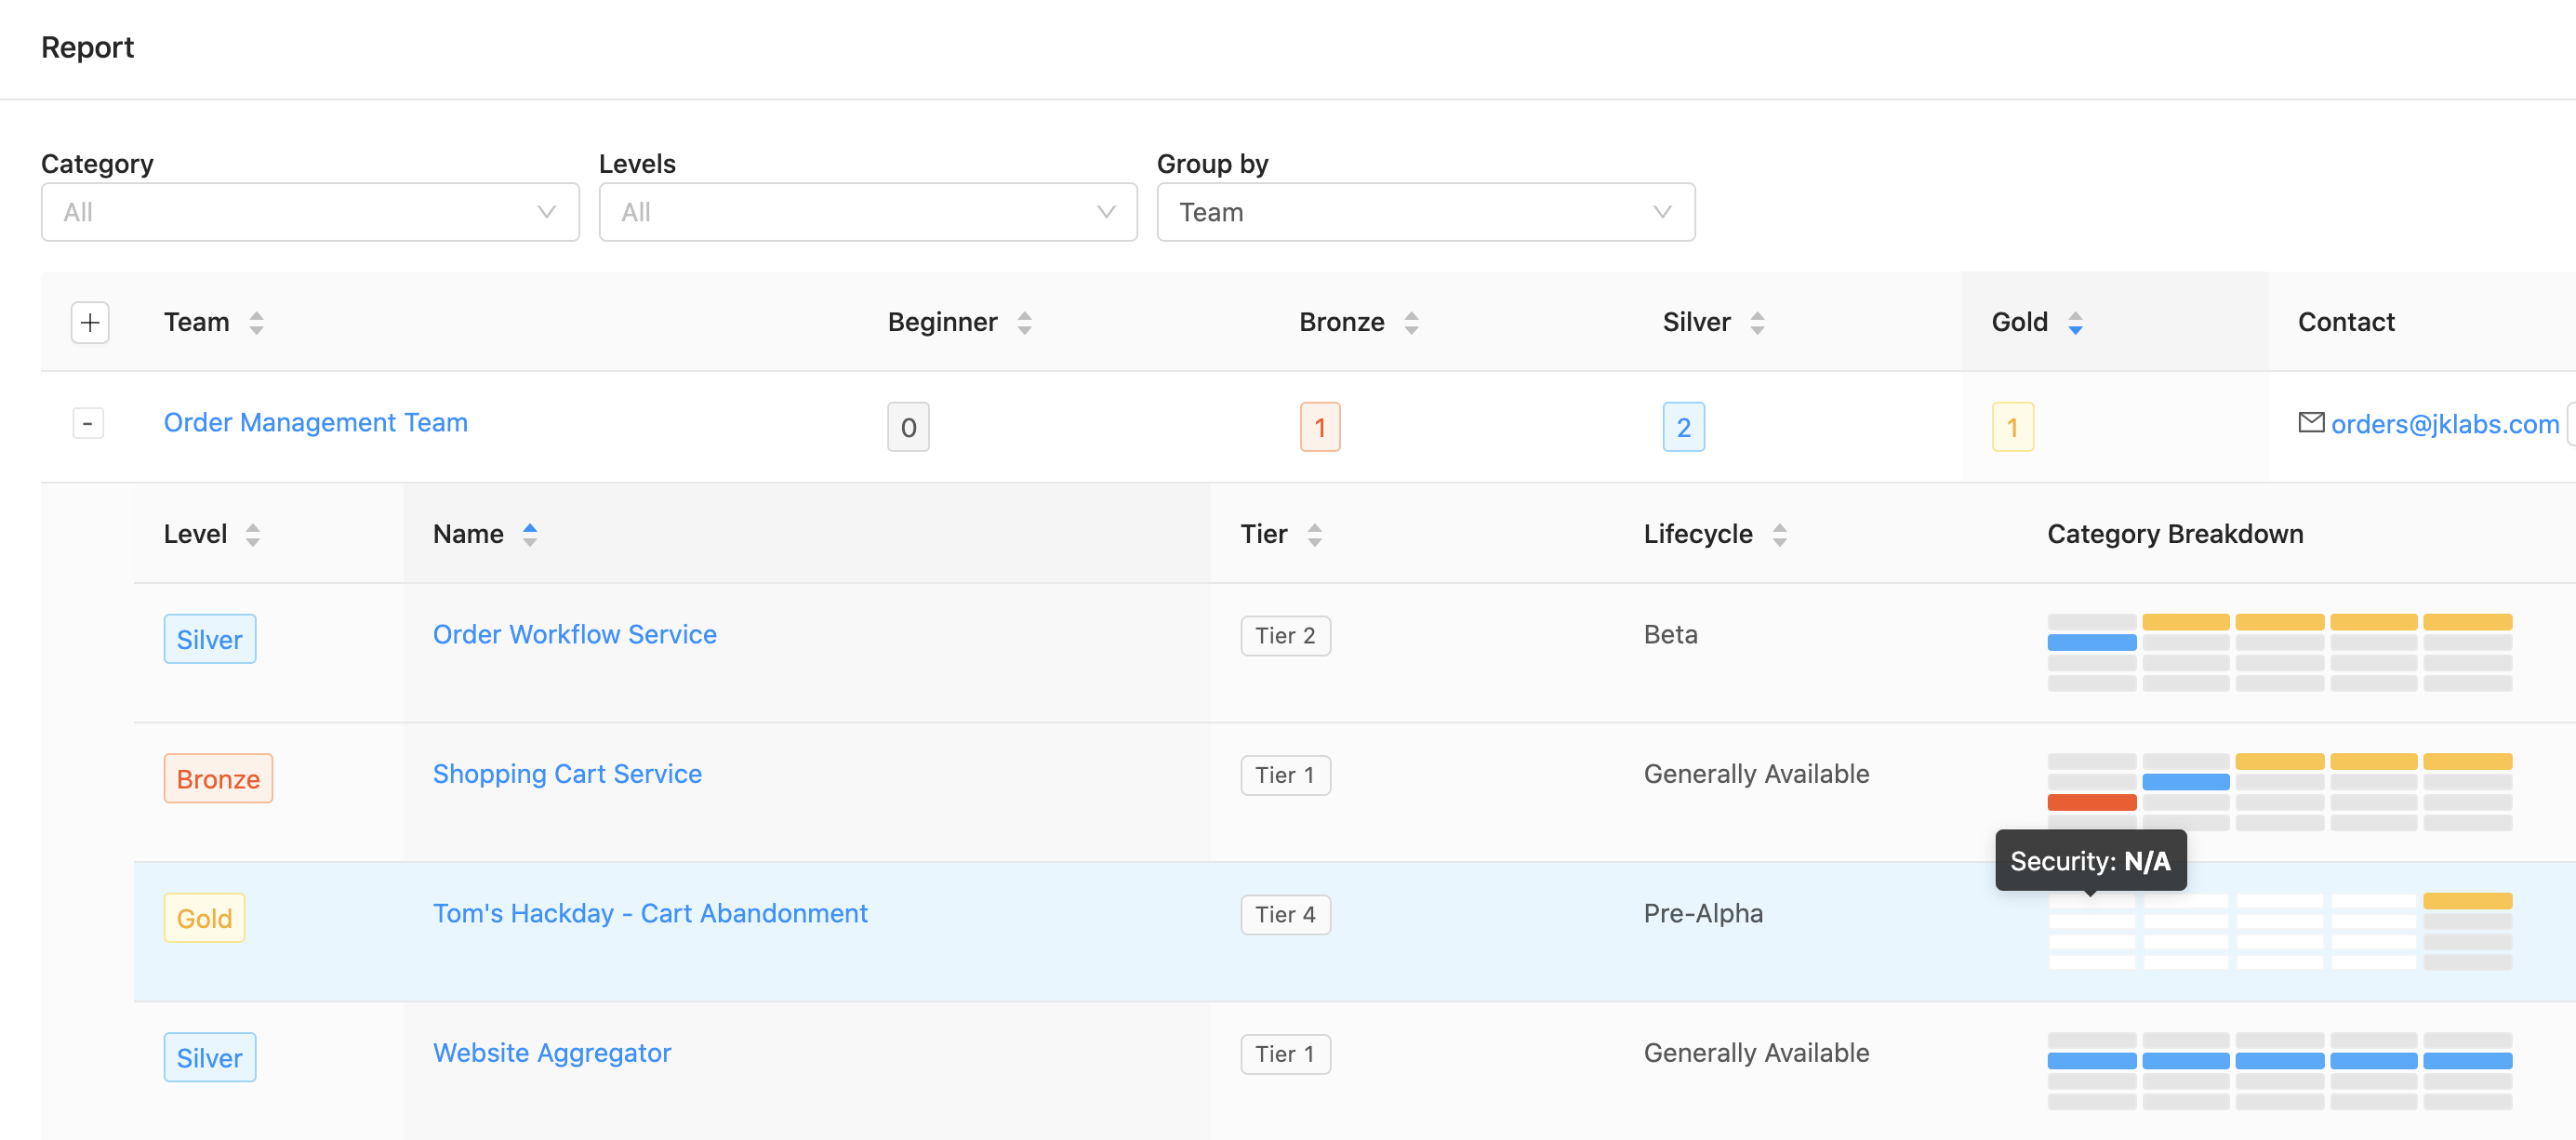
Component Maturity Report Group by Team Missing Category
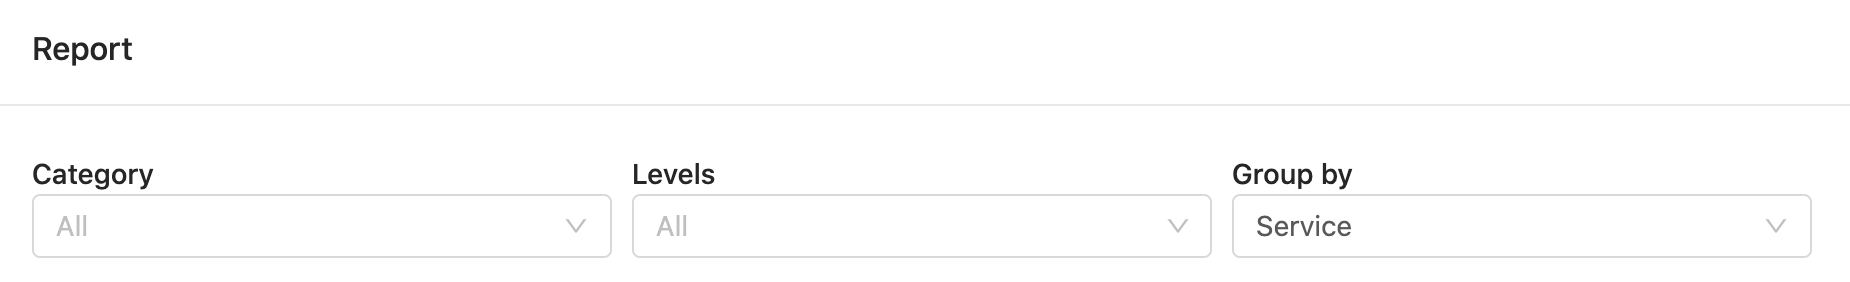
If you’re less concerned about teams and just want to get a general idea about how your components are performing, you can select Component in the Group By drop-down. This will display a list of all your components and show their Level and Category Breakdown.
Component Maturity Report Group by Component
Filters
You can select different filters at the top of the page. For example, you can use the Owner filter to select all your team's components. These filters will affect both the Charts and the Report.
Component Maturity Report Filters
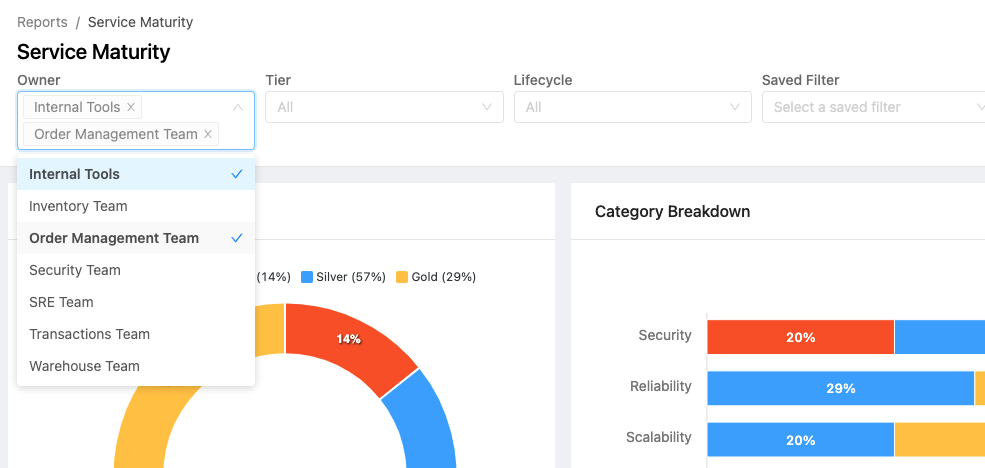
When multiple options are selected within a filter, OpsLevel will return components matching any of those options. For example, selecting two teams in the Owner filter will return components owned by either of those two teams.
When different filters are combined, OpsLevel will return components matching all of those filters. For example, selecting Inventory Team in the Owner filter and Tier 1 in the Tier filter will return Tier 1 components that are owned by the Inventory Team.
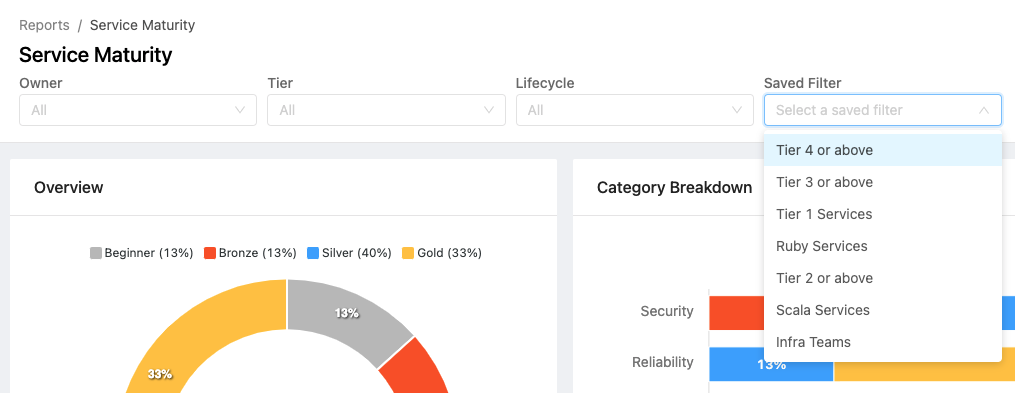
The last filter entitled Saved Filter lets you select existing filters that have already been defined on your rubric. These advanced filters let you filter by additional component properties and they let you combine multiple filter conditions. For example, you could use a Saved Filter to find all Tier 1 component written in Javascript. The Checks and Filters docs have more info about these advanced rubric filters.
Component Maturity Report Saved Filters
The filters that are selected will be updated in the browser's url which allow you to easily share different views of the report.
Report Filters
The Report section has additional filters that can be selected. These filters only apply to the Report, they don't apply to the Charts. For simplicity, the examples below will use these filters when grouping by component but the filters also work when grouping by team.
Report Specific Filters
The Level filter can be used to view components that have a certain level. It's a great way to quickly identify the best/worst performing components in your organization. If more than one level is selected, it will show components containing any of those levels.
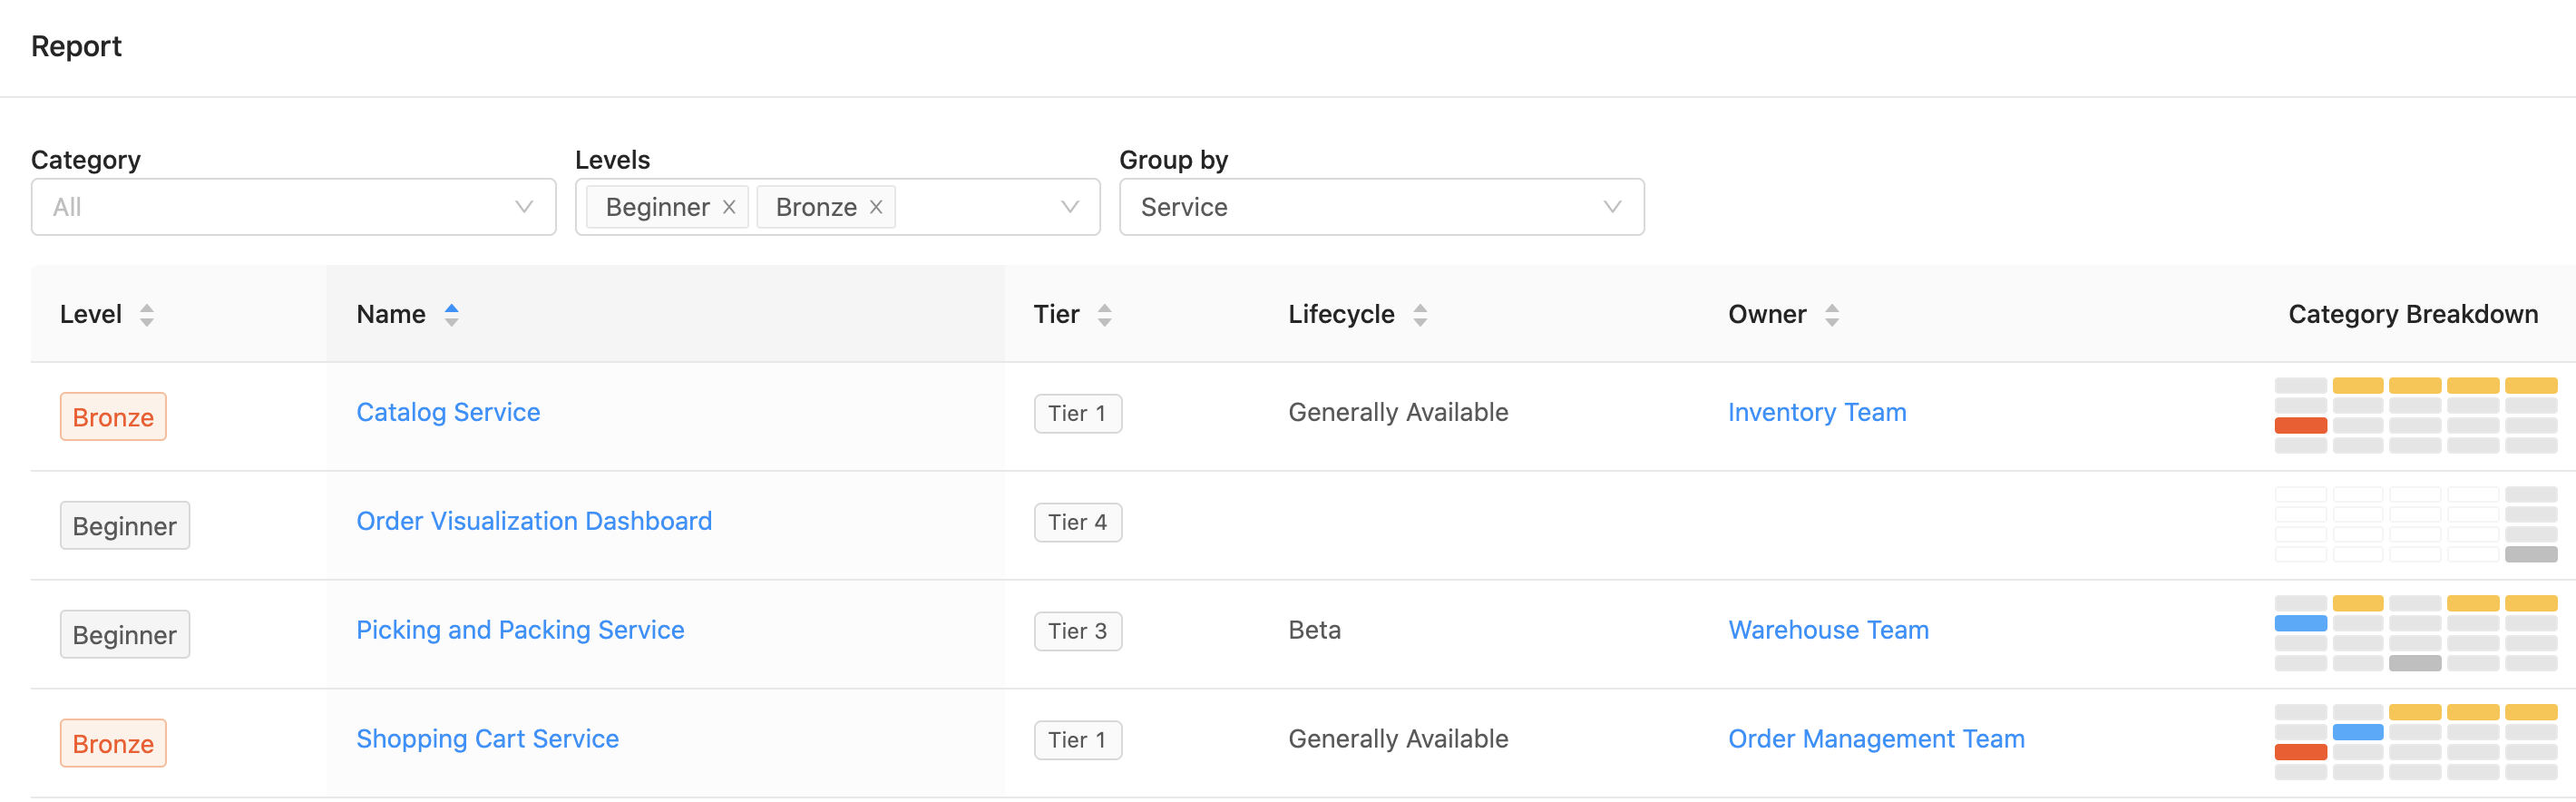
Component Maturity Report Level Filtering
The Category filter can be used to view how components are performing against a specific category. When this filter is selected, the level displayed for each component will be the component's level for that specific category. Components that don't have a level for that category will be filtered out.
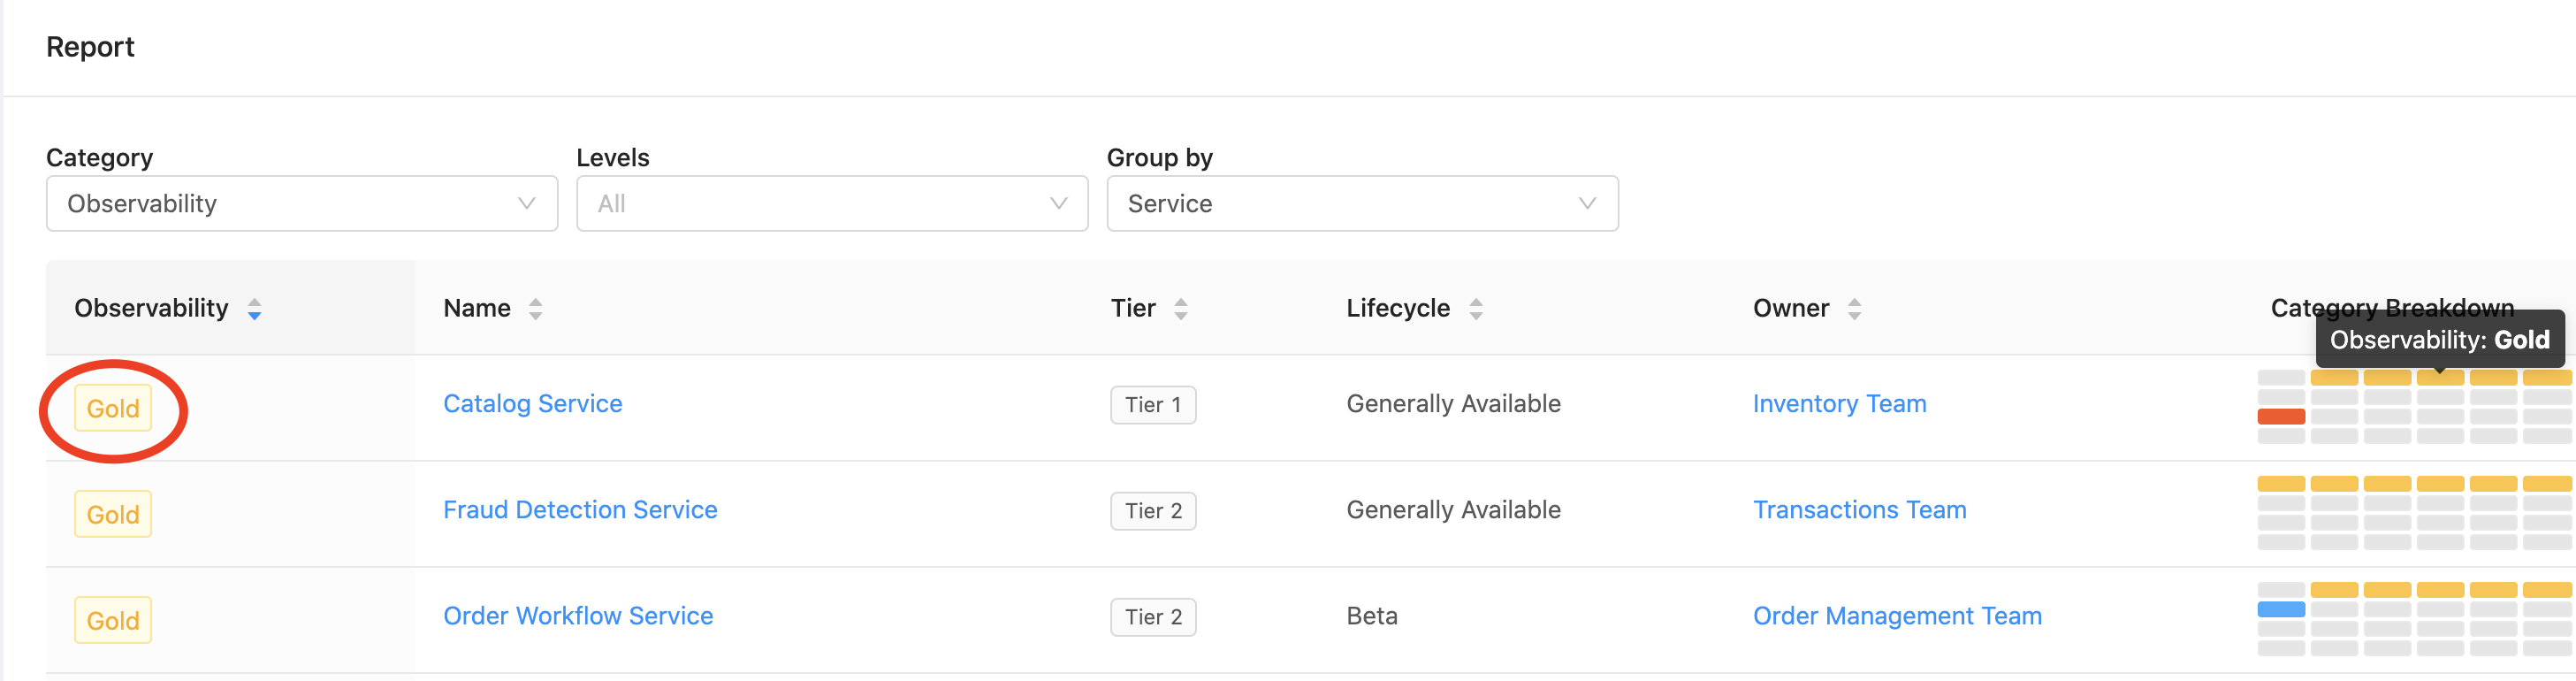
Component Maturity Report Category Filtering
When the Category filter is combined with the Level filter, it will show components with a certain level for the selected category. For example, you can use these filters to find the components with a level of Bronze in the Security category.
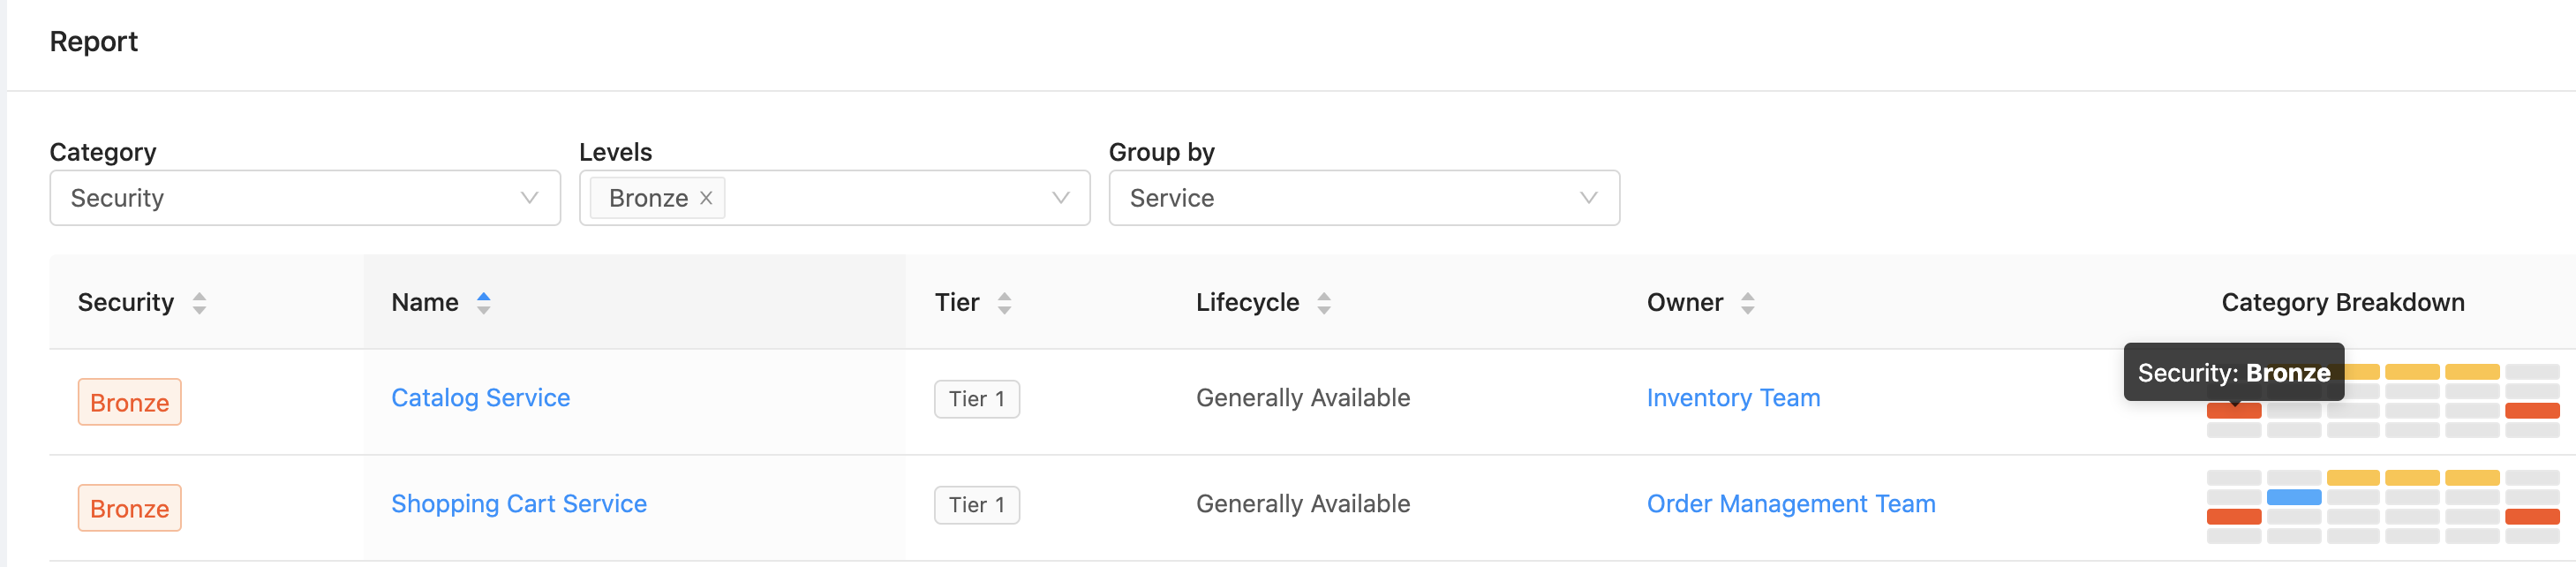
Components Maturity Report Category and Level Filtering
Similar to the other filters at the top of the page, these report filters will be stored in the URL to allow you to easily share different views of the report.
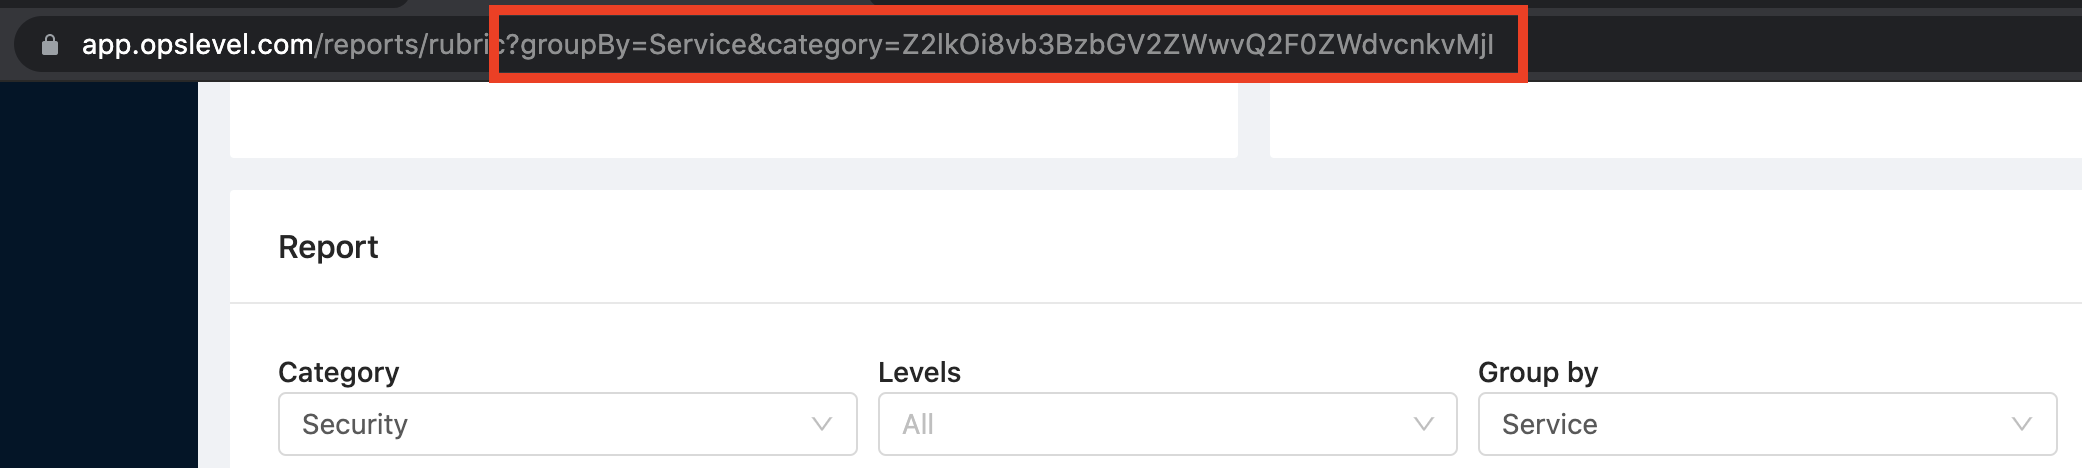
Component Maturity Report Url Persistence
Updated 7 months ago