Prometheus Integration
Add Prometheus alert checks to your Service Maturity rubric.
Add a Prometheus Integration
- In the OpsLevel app, mouse over Integrations in the left sidebar
- Click Add New Integration in the pop up menu
- Search for Prometheus
- Click Add Integration on the Prometheus card
- Follow the instructions in the new Integration page to configure Prometheus Alert Manager to send alerts to OpsLevel
Configuring Prometheus and Alert Manager to send data to OpsLevel
1. Configure the alert rules for your SLO Alert with labels to identify the service alias and the event type
labels:
  alias: "{{ $labels.instance }}" # Use an appropriate template
  event_type: metric_slo_alert
2. Add OpsLevel as a webhook receiver and set it as a route in your alertmanager.yml
route:
  group_by: ['alertname']
  group_wait: 30s
  group_interval: 1m
  repeat_interval: 1m
  receiver: 'web.hook'
receivers:
  - name: 'web.hook'
    webhook_configs:
      - url: "${WEBHOOK_URL}"
Reload your Prometheus and Prometheus Alert Manager configurations.
Create a Check
1. Navigate to the Rubrics sub menu under the Service Maturity menu in OpsLevel.
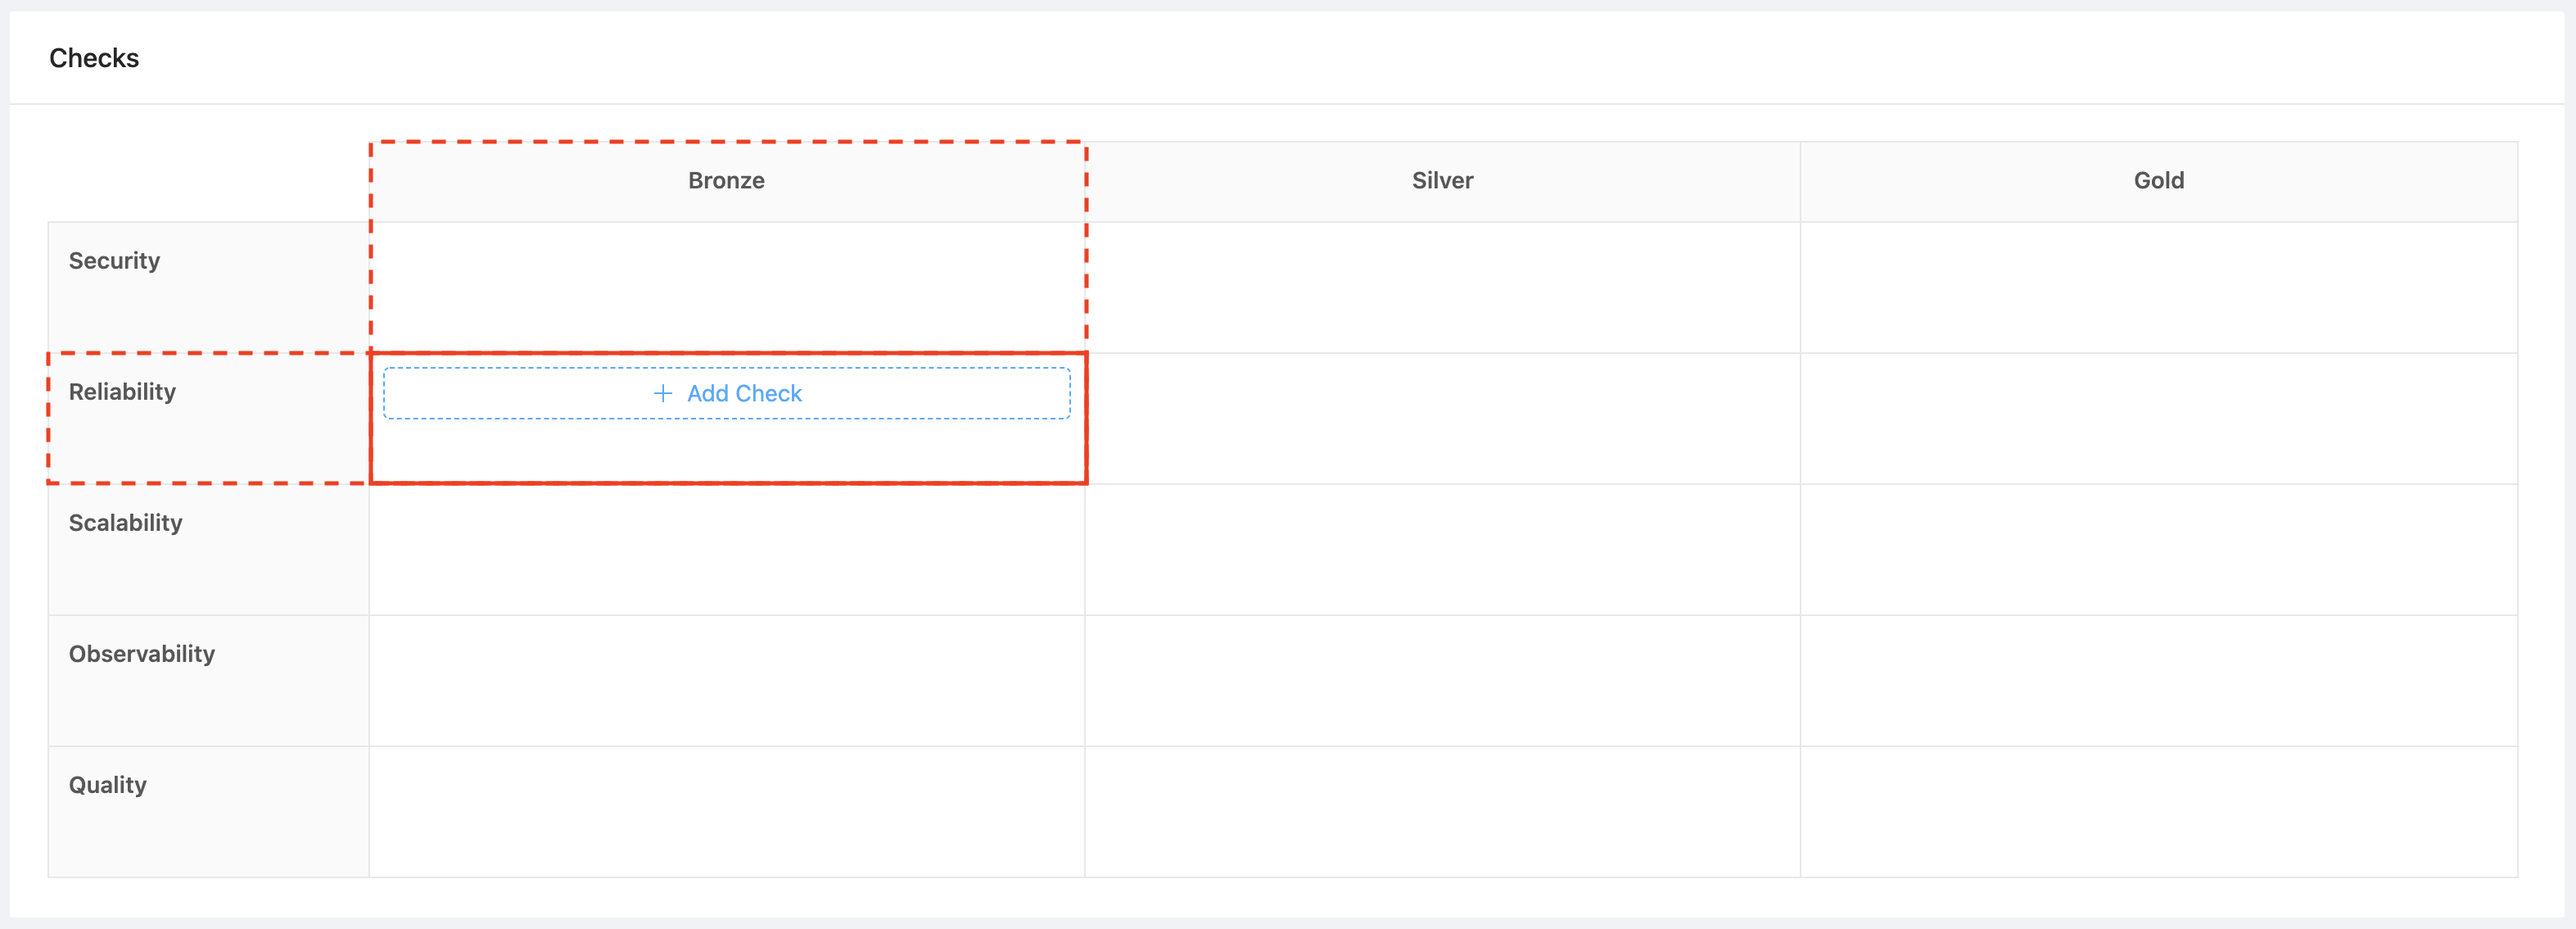
2. Hover over the cell that corresponds to the level and category you want your check to live in and click the +Add Check button.
3. Create a Prometheus check under Integrations
.png)
4. The Check for SLO error budget alert will be pre-selected
This check will pass or fail if an alert for a service is triggered from Prometheus Alert Manager
Updated 7 months ago